

Louisville Inventory & Competition: September 2026 Update
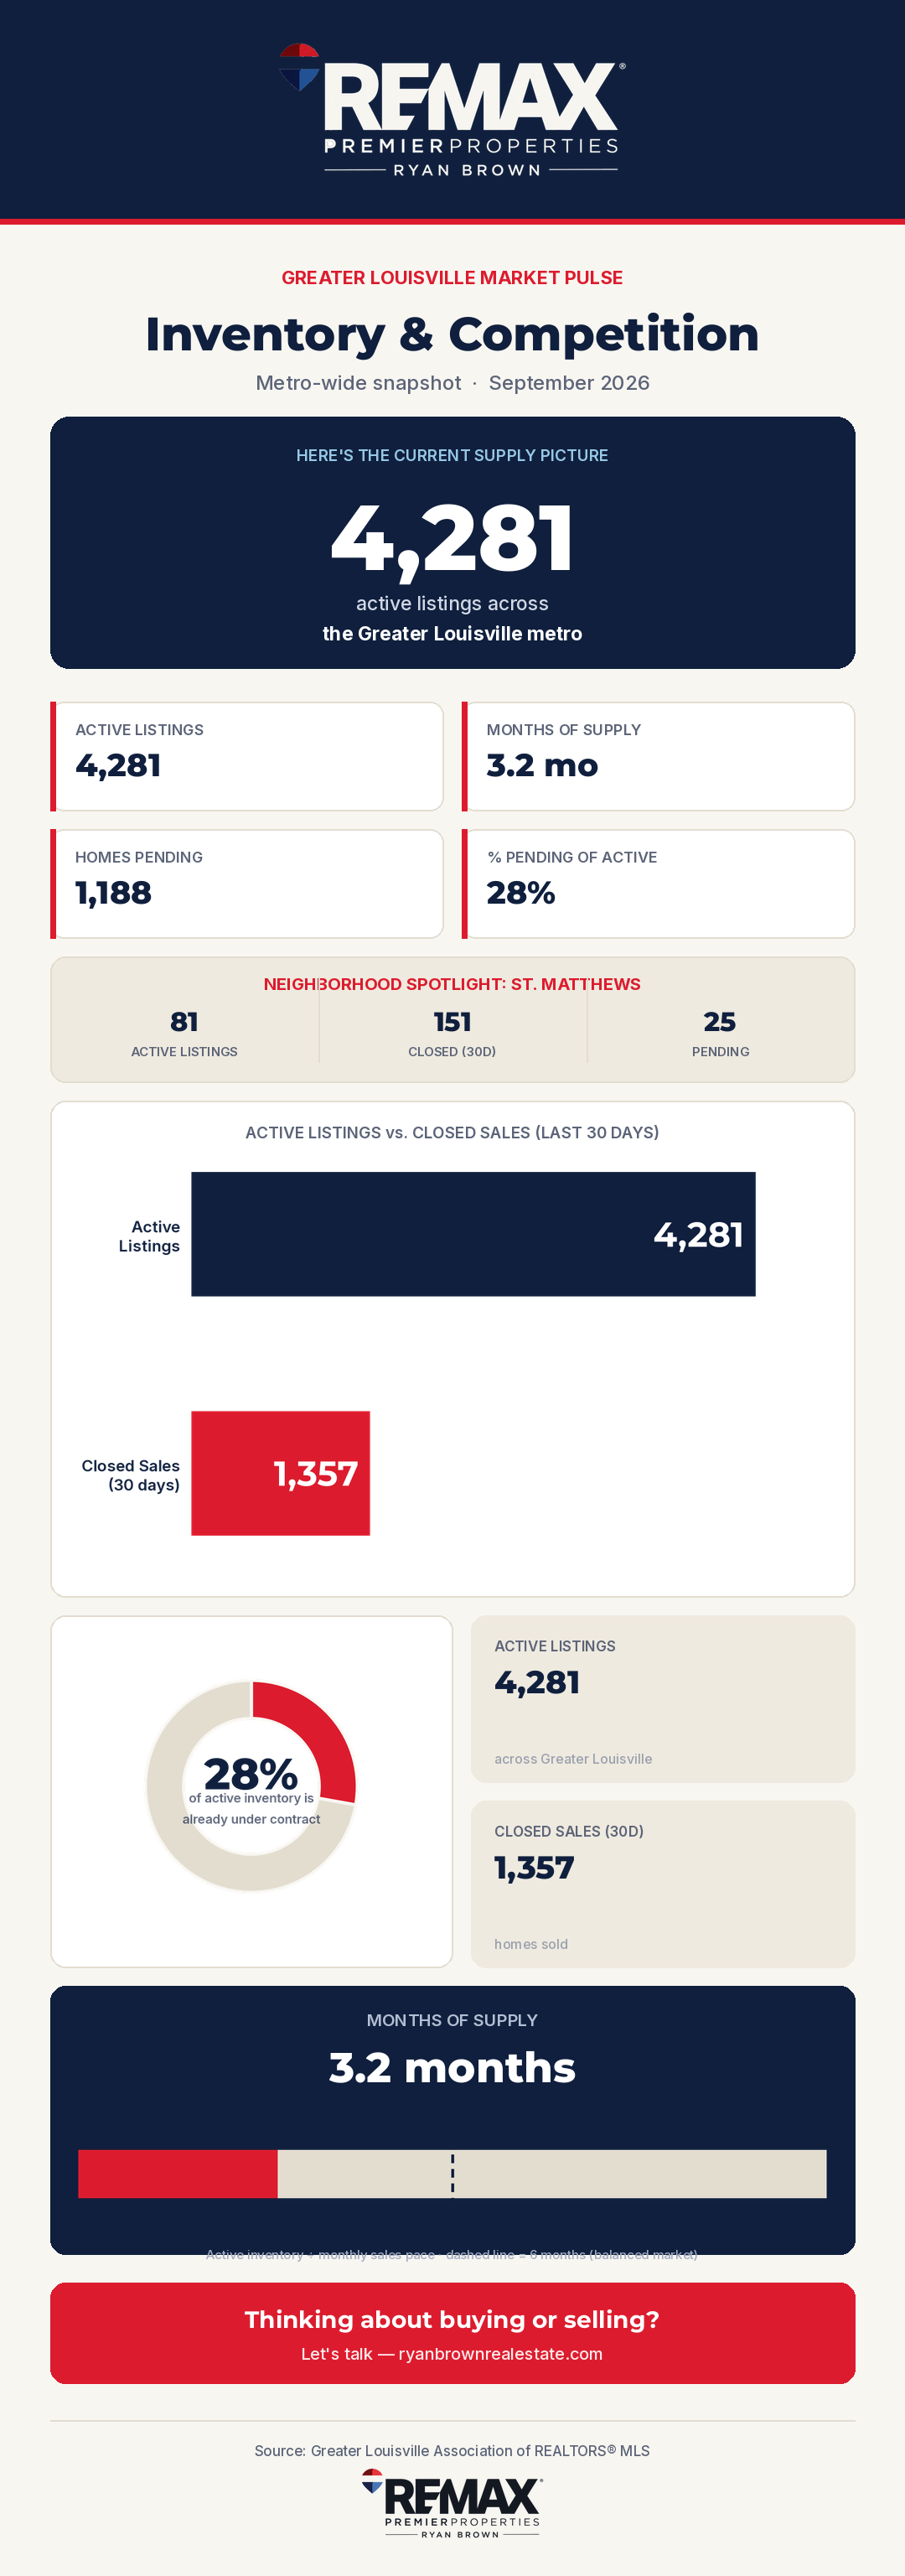
Supply and competition shape everything from list price strategy to how quickly you need to act on a home you love. Here's the current picture across Greater Louisville — plus a closer look at St. Matthews.
The headline number: 4,281 active listings
That translates to roughly 3.2 months of supply at the current sales pace — a seller's market by the traditional 6-month benchmark.
The competition picture
- Active listings: 4,281
- Months of supply: 3.2
- Homes currently pending: 1,188 (28% of active inventory)
- Closed sales (last 30 days): 1,357
Neighborhood spotlight: St. Matthews
In St. Matthews, there are 81 active listings, 25 pending, and 151 closed sales in the last 30 days.
What this means if you're selling
With 28% of active inventory already under contract, well-priced homes are still finding buyers. Standing out among 4,281 active listings still comes down to pricing and presentation.
What this means if you're buying
At 3.2 months of supply, you'll want to move decisively on homes you love. Watch the pending count — it's the clearest real-time signal of how much competition you're facing.
Bottom line: Inventory shapes strategy on both sides of the table. Whether you're weighing when to list or how aggressively to offer, current supply numbers are the place to start.
What “months of supply” actually measures
Months of supply answers a simple question: at the current pace of sales, how long would it take to sell every active listing if no new homes came on the market? Under about 4 months typically favors sellers, 4-6 months is roughly balanced, and above 6 months tends to favor buyers. At 3.2 months, Greater Louisville is squarely in seller's-market territory — though that number varies meaningfully by neighborhood and price point, so a citywide average can mask a much tighter or looser market on your specific street.
Reading the pending percentage
The 28% of active inventory currently pending is a leading indicator — it reflects deals already made, not just homes sitting on the market. A rising pending percentage month over month usually means demand is strengthening; a falling one can be an early signal that buyer activity is cooling before it shows up in the closed-sales numbers.
What this means for your specific plans
If you're selling, low months of supply is your leverage — but it only helps if your home is priced and presented to compete with the 4,281 other active listings. If you're buying, low supply means less time to deliberate and more need for a clear pre-approval and a realistic offer strategy going in, especially in tighter submarkets like St. Matthews.
Source: Greater Louisville Association of REALTORS® MLS, active, pending, and closed listing data as of September 2026.
Thinking about buying or selling in this market?
Let's talk about what these numbers mean for your specific situation.
Send a Message