

Greater Louisville real estate market snapshots.
A running series pulled straight from GLAR MLS data — pricing trends, market speed, and inventory & competition, rotating through the Greater Louisville metro. New snapshot added regularly.
 Market Speed
October 2026
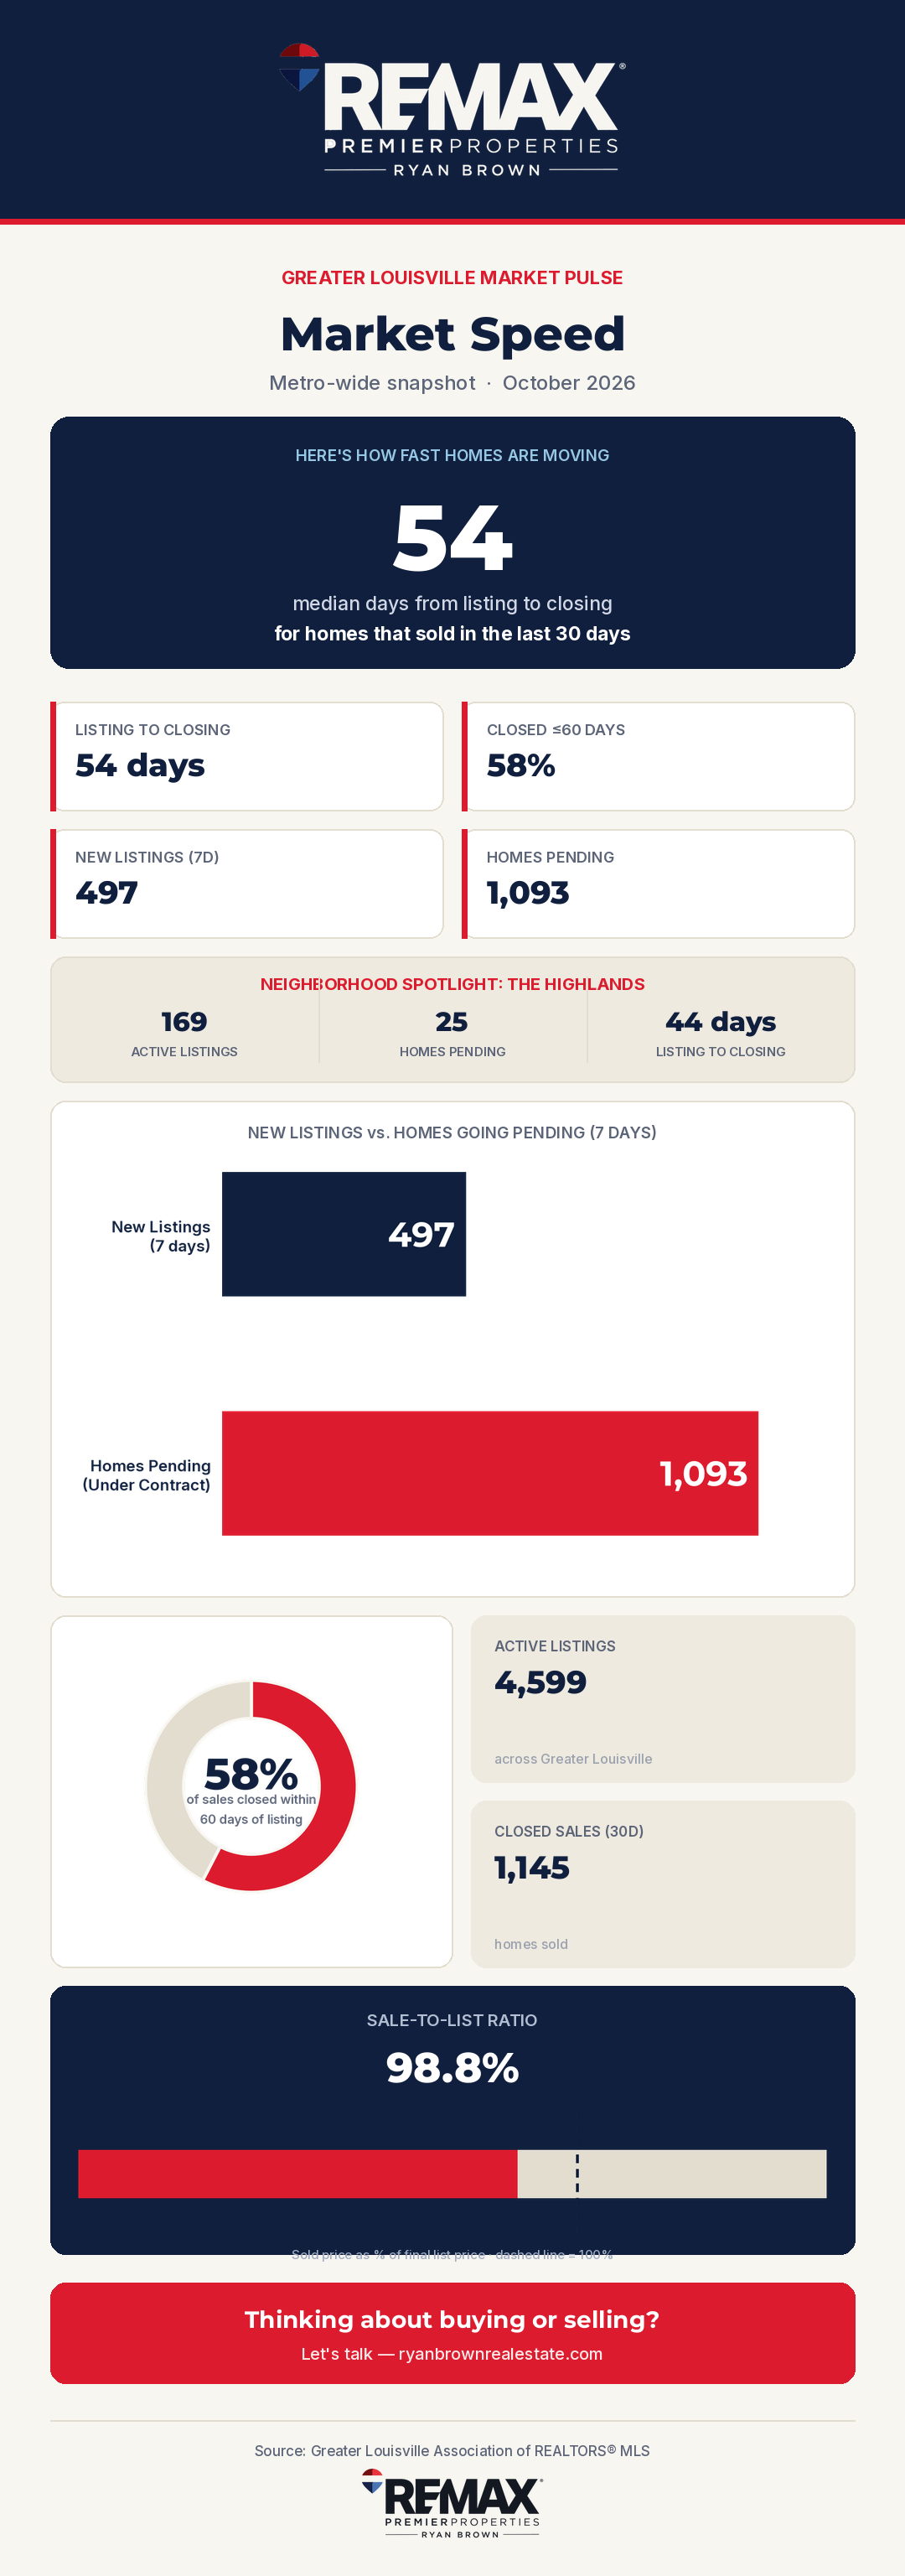
Louisville Market Speed: October 2026 Update
Homes in Greater Louisville are closing a median of 54 days after listing, with a spotlight on the Highlands this edition.
Read the snapshot →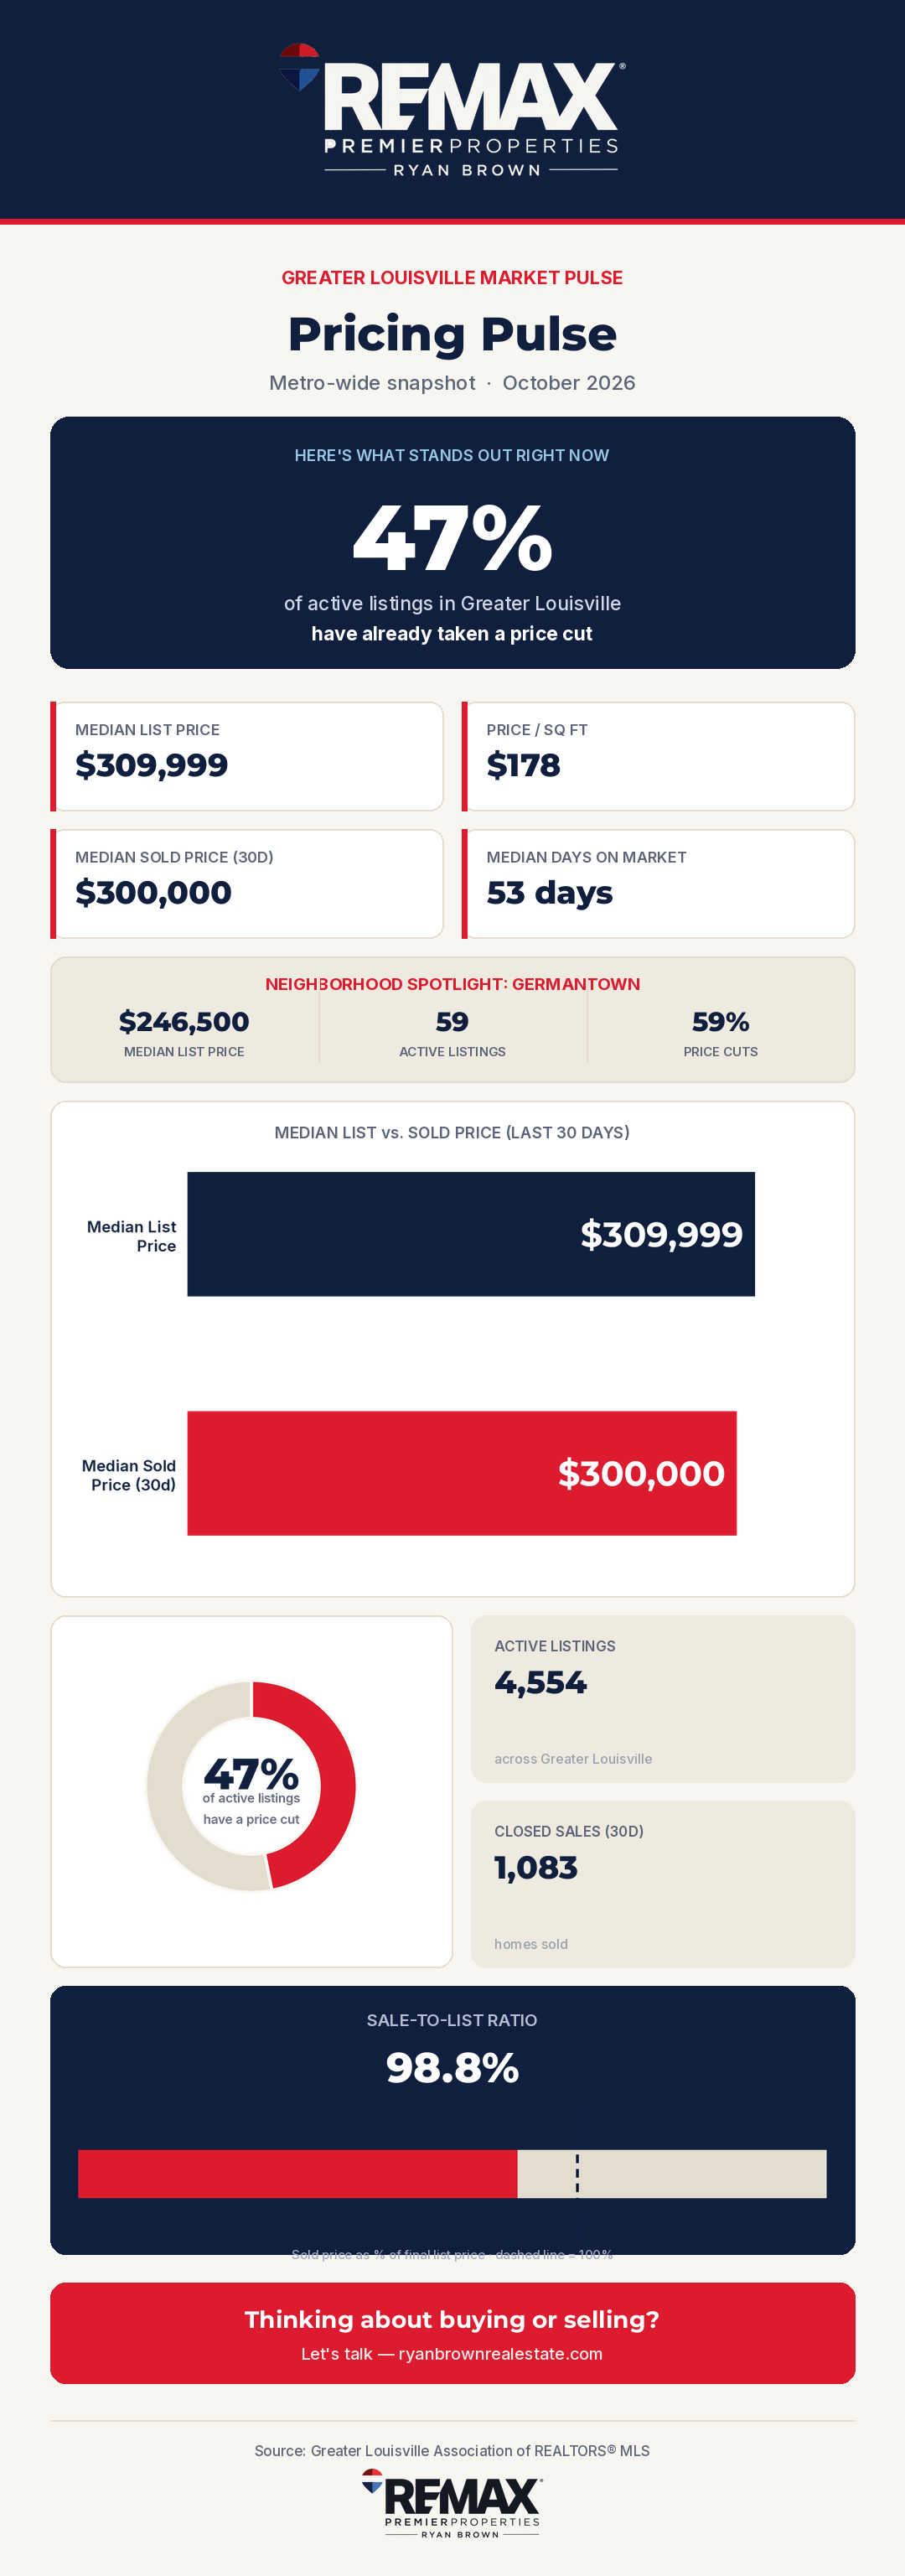 Pricing Pulse
October 2026
Louisville Market Pulse: October 2026 Pricing Snapshot
47% of active listings across Greater Louisville have already taken a price cut, with a Germantown spotlight this edition.
Read the snapshot →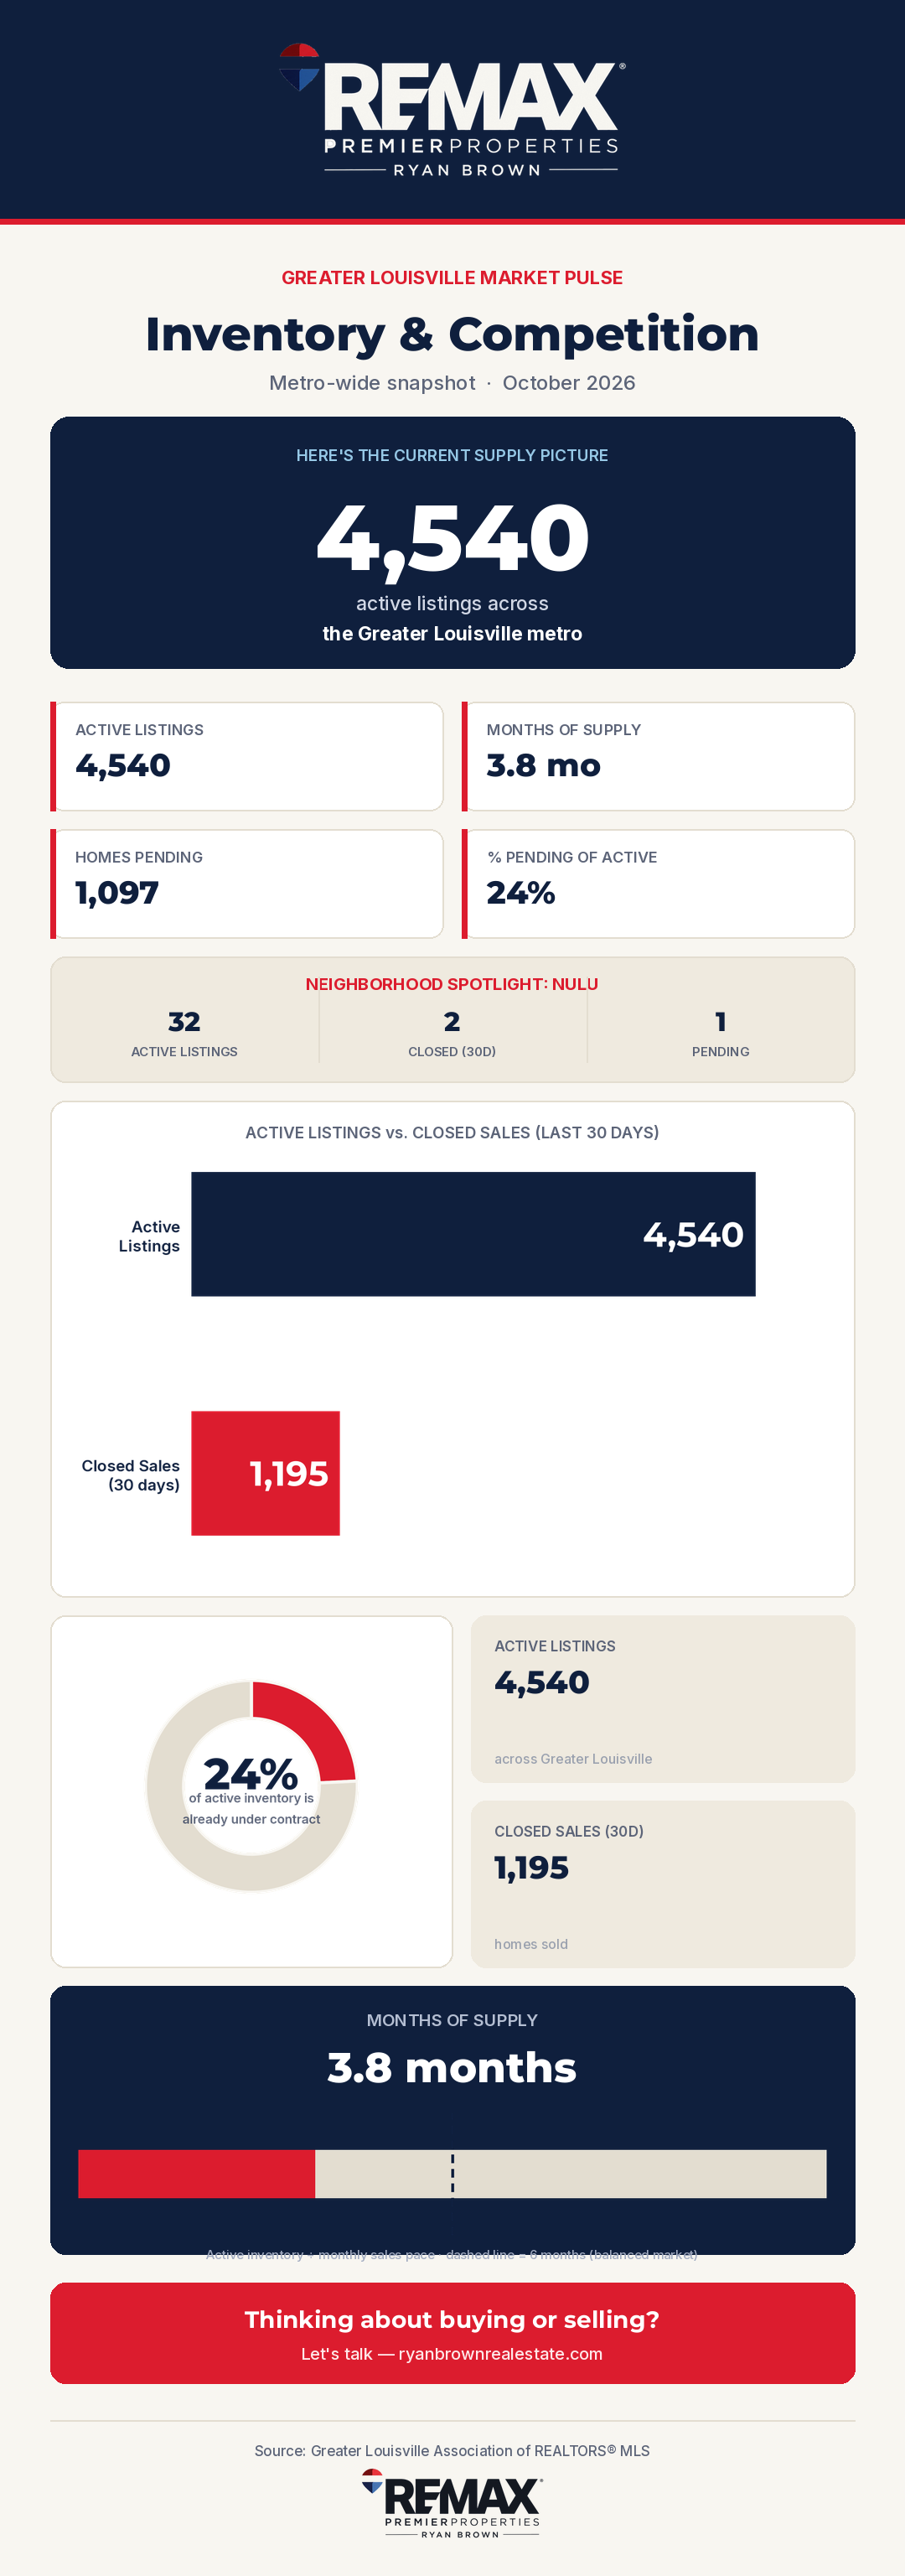 Inventory & Competition
October 2026
Louisville Inventory & Competition: October 2026 Update
4,540 active listings across Greater Louisville, 3.8 months of supply, with a NuLu spotlight this edition.
Read the snapshot →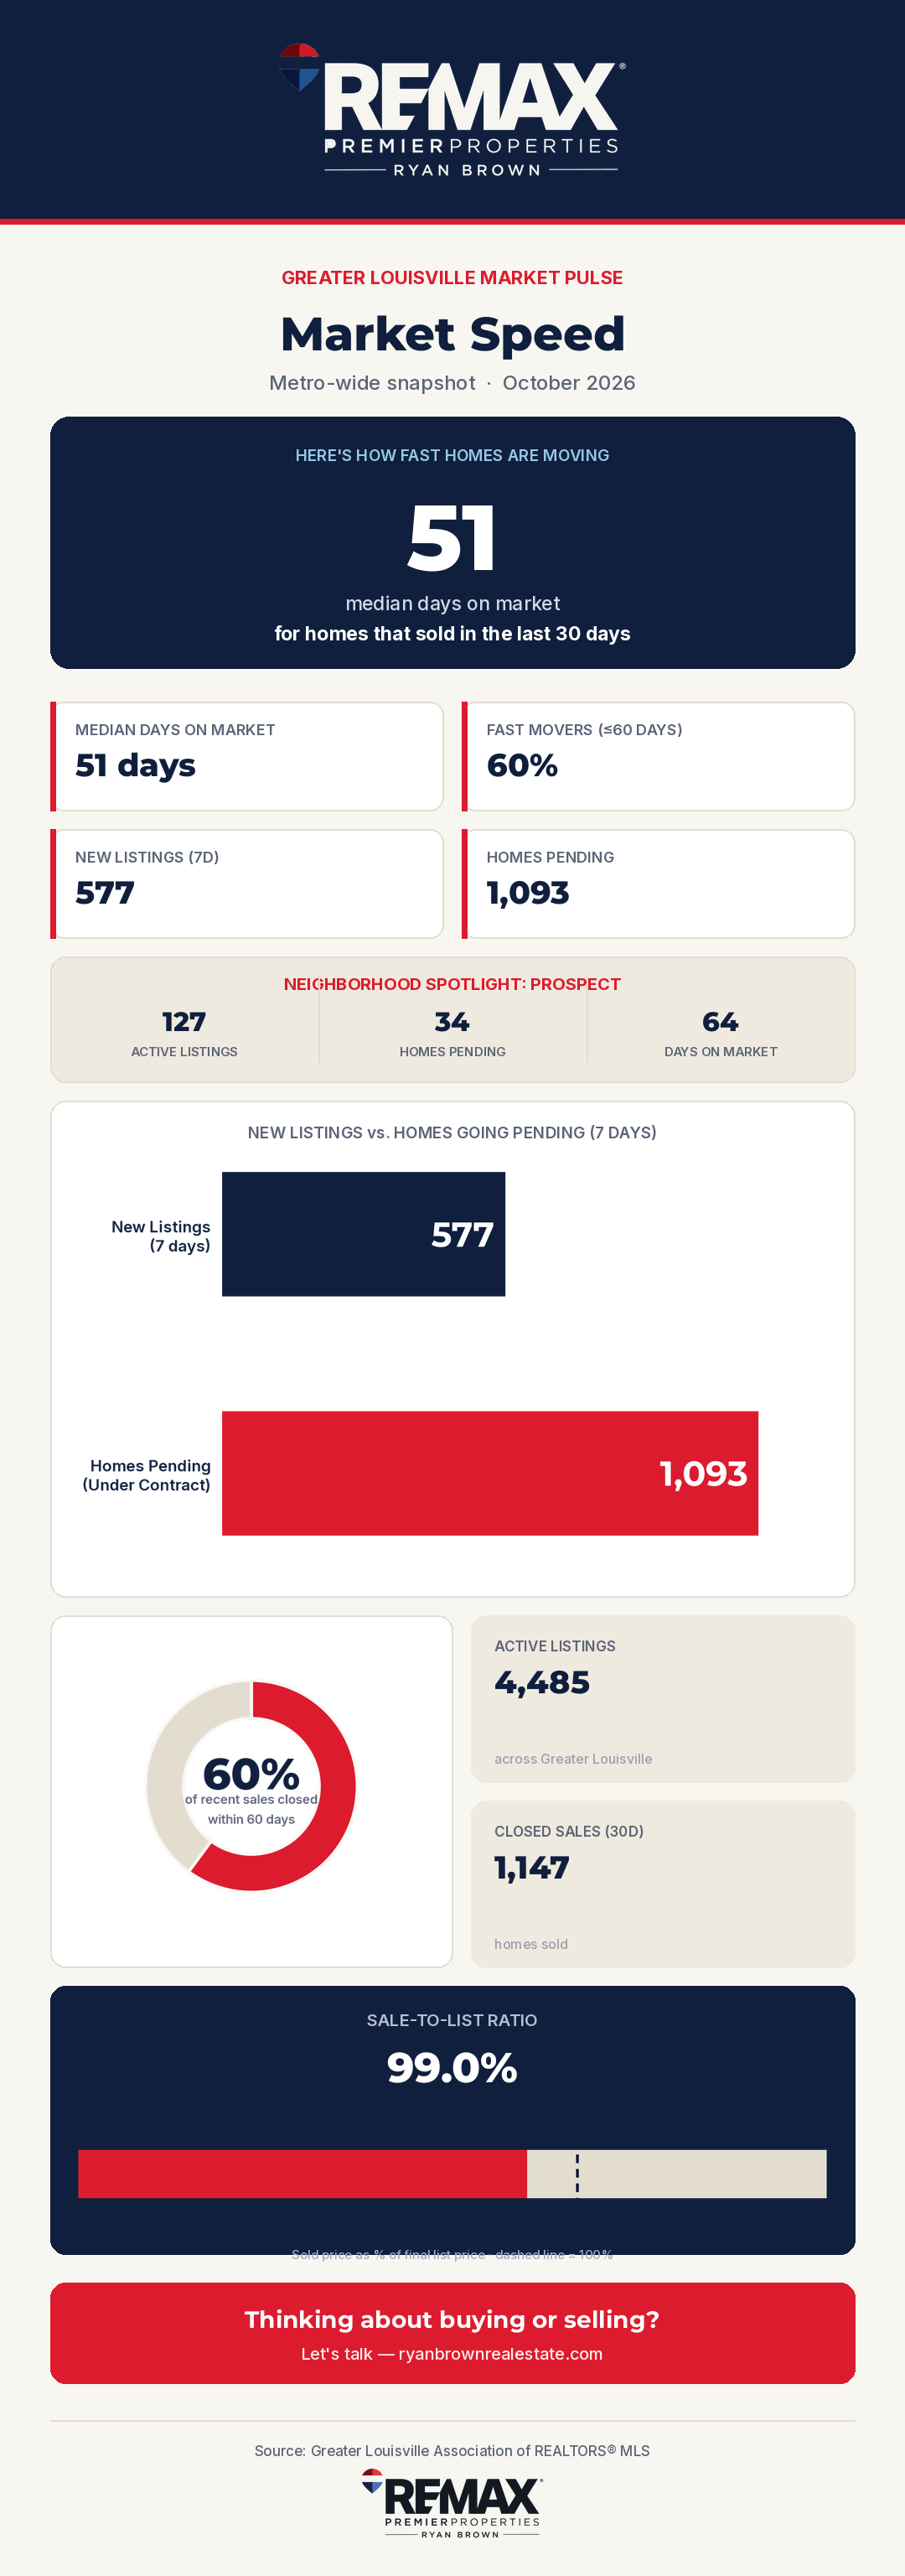 Market Speed
October 2026
Louisville Market Speed: October 2026 Update
Homes in Greater Louisville are closing a median of 51 days after listing, with a Prospect spotlight this edition.
Read the snapshot →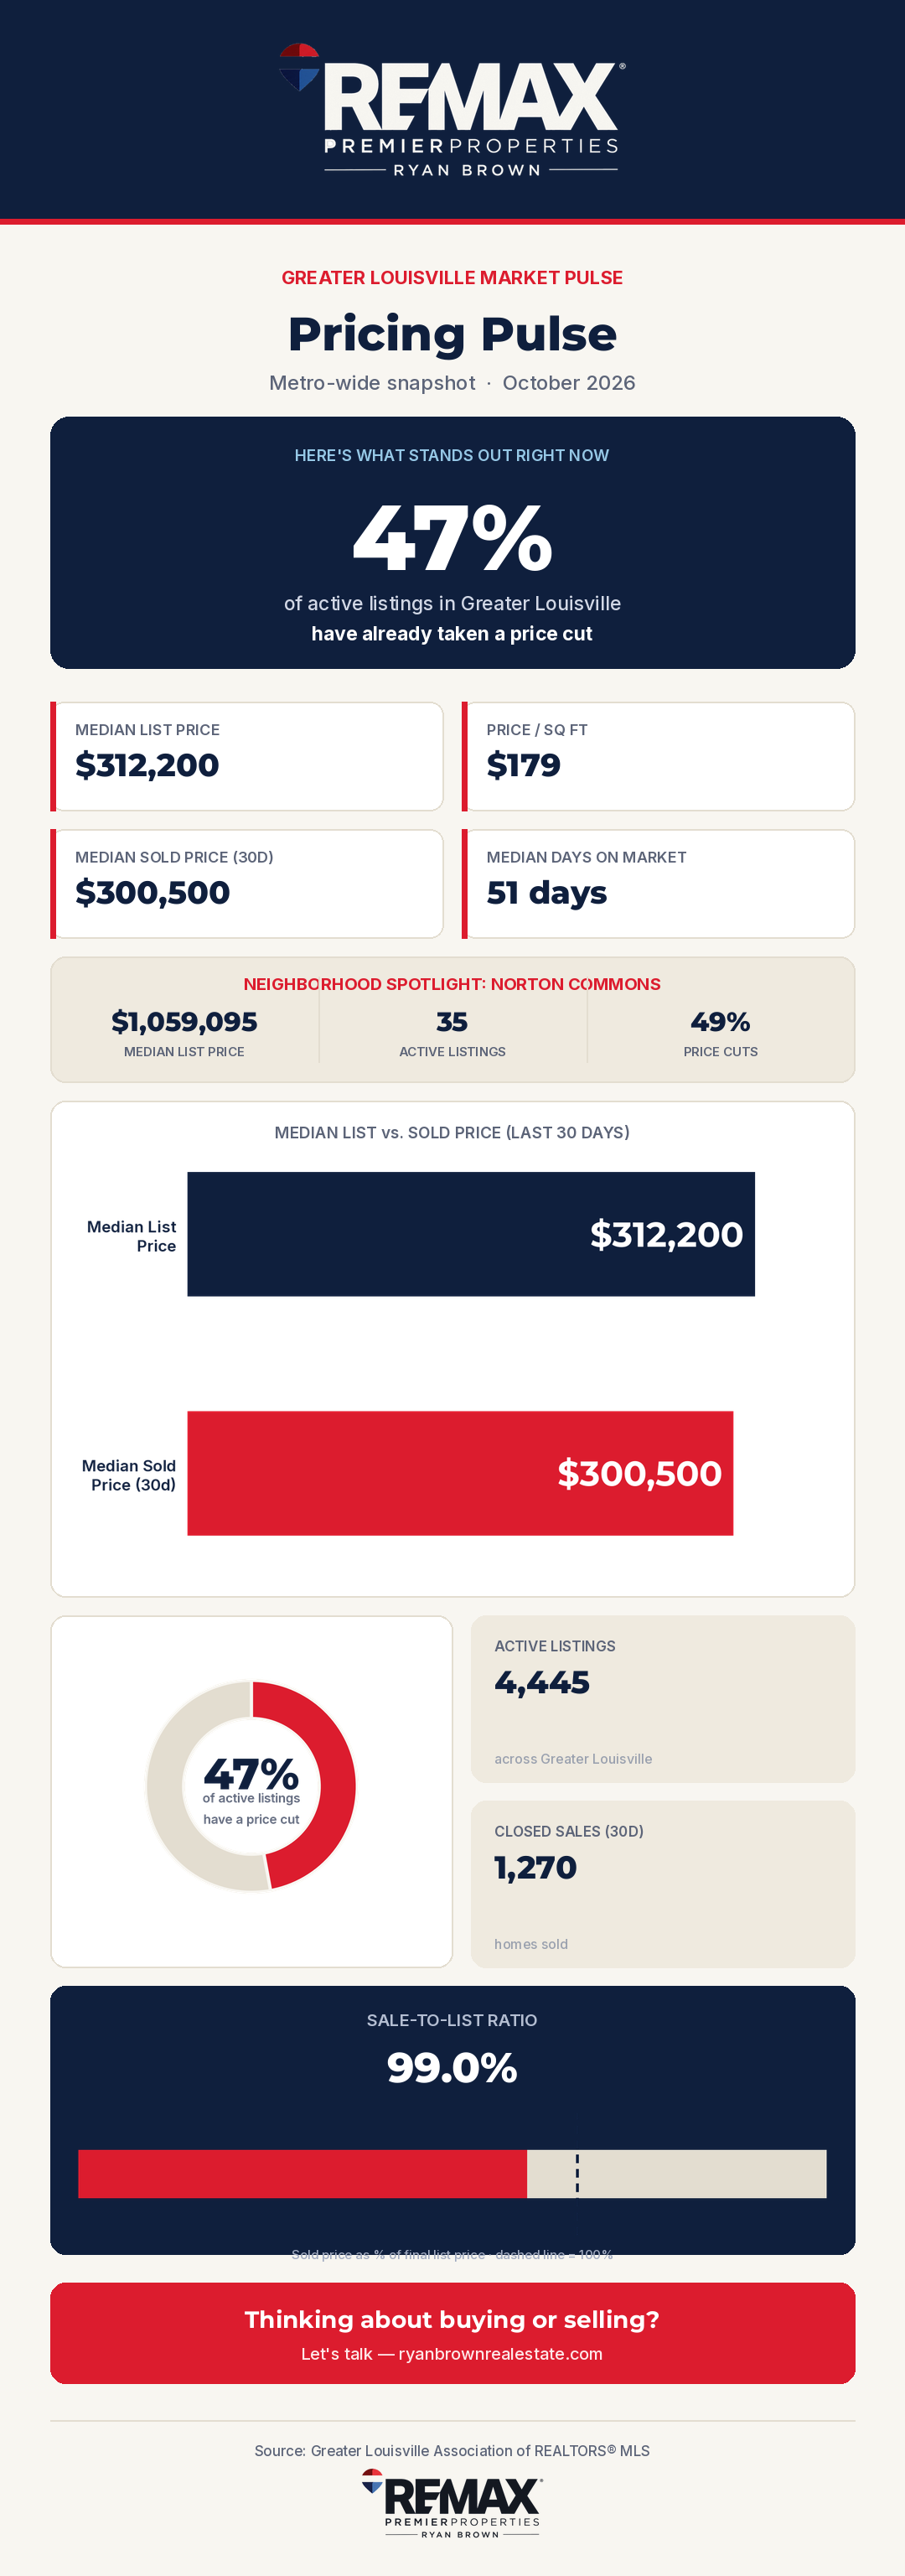 Pricing Pulse
October 2026
Louisville Market Pulse: October 2026 Pricing Snapshot
47% of active listings across Greater Louisville have already taken a price cut, with a Norton Commons spotlight this edition.
Read the snapshot →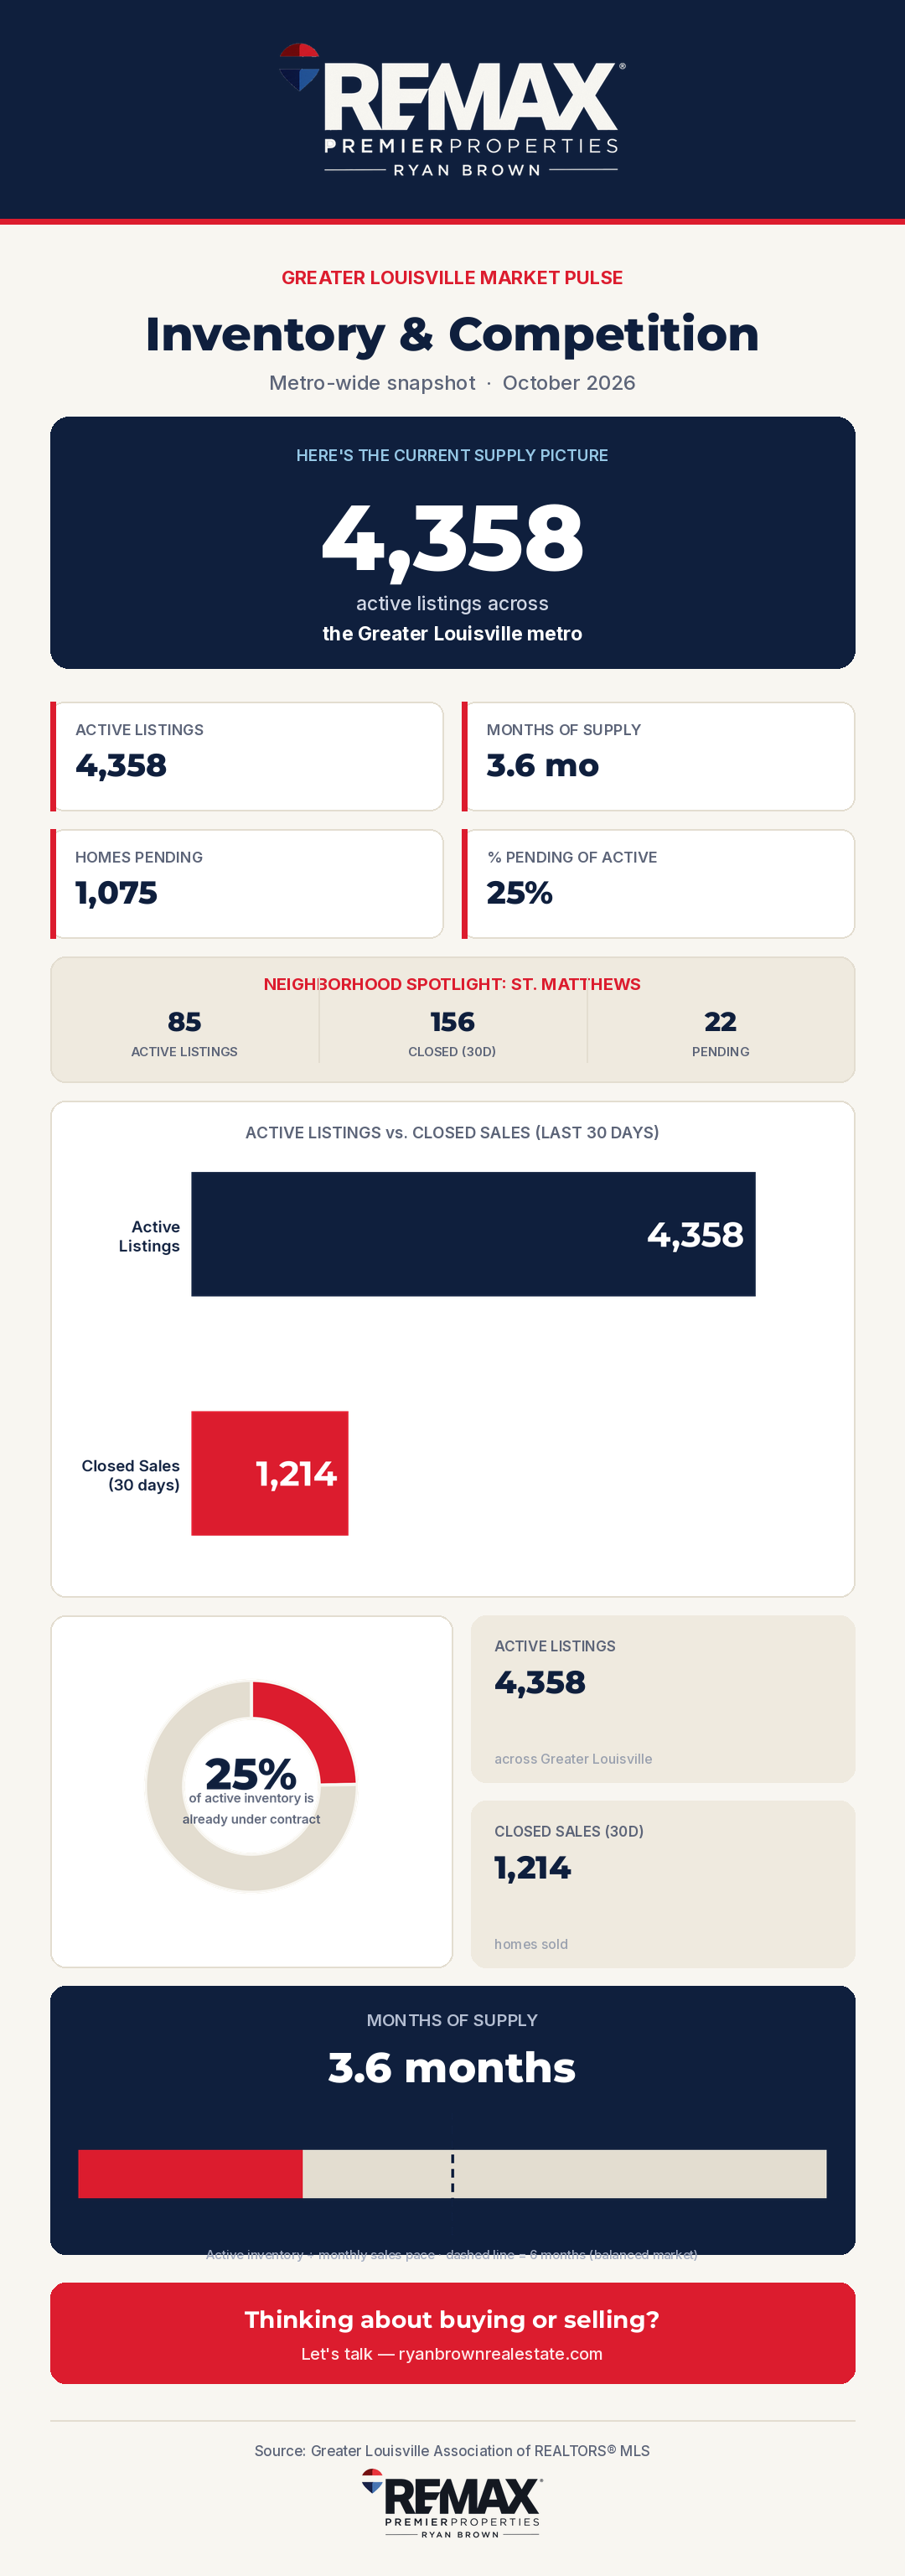 Inventory & Competition
October 2026
Louisville Inventory & Competition: October 2026 Update
4,358 active listings across Greater Louisville, 3.6 months of supply, with a St. Matthews spotlight this edition.
Read the snapshot →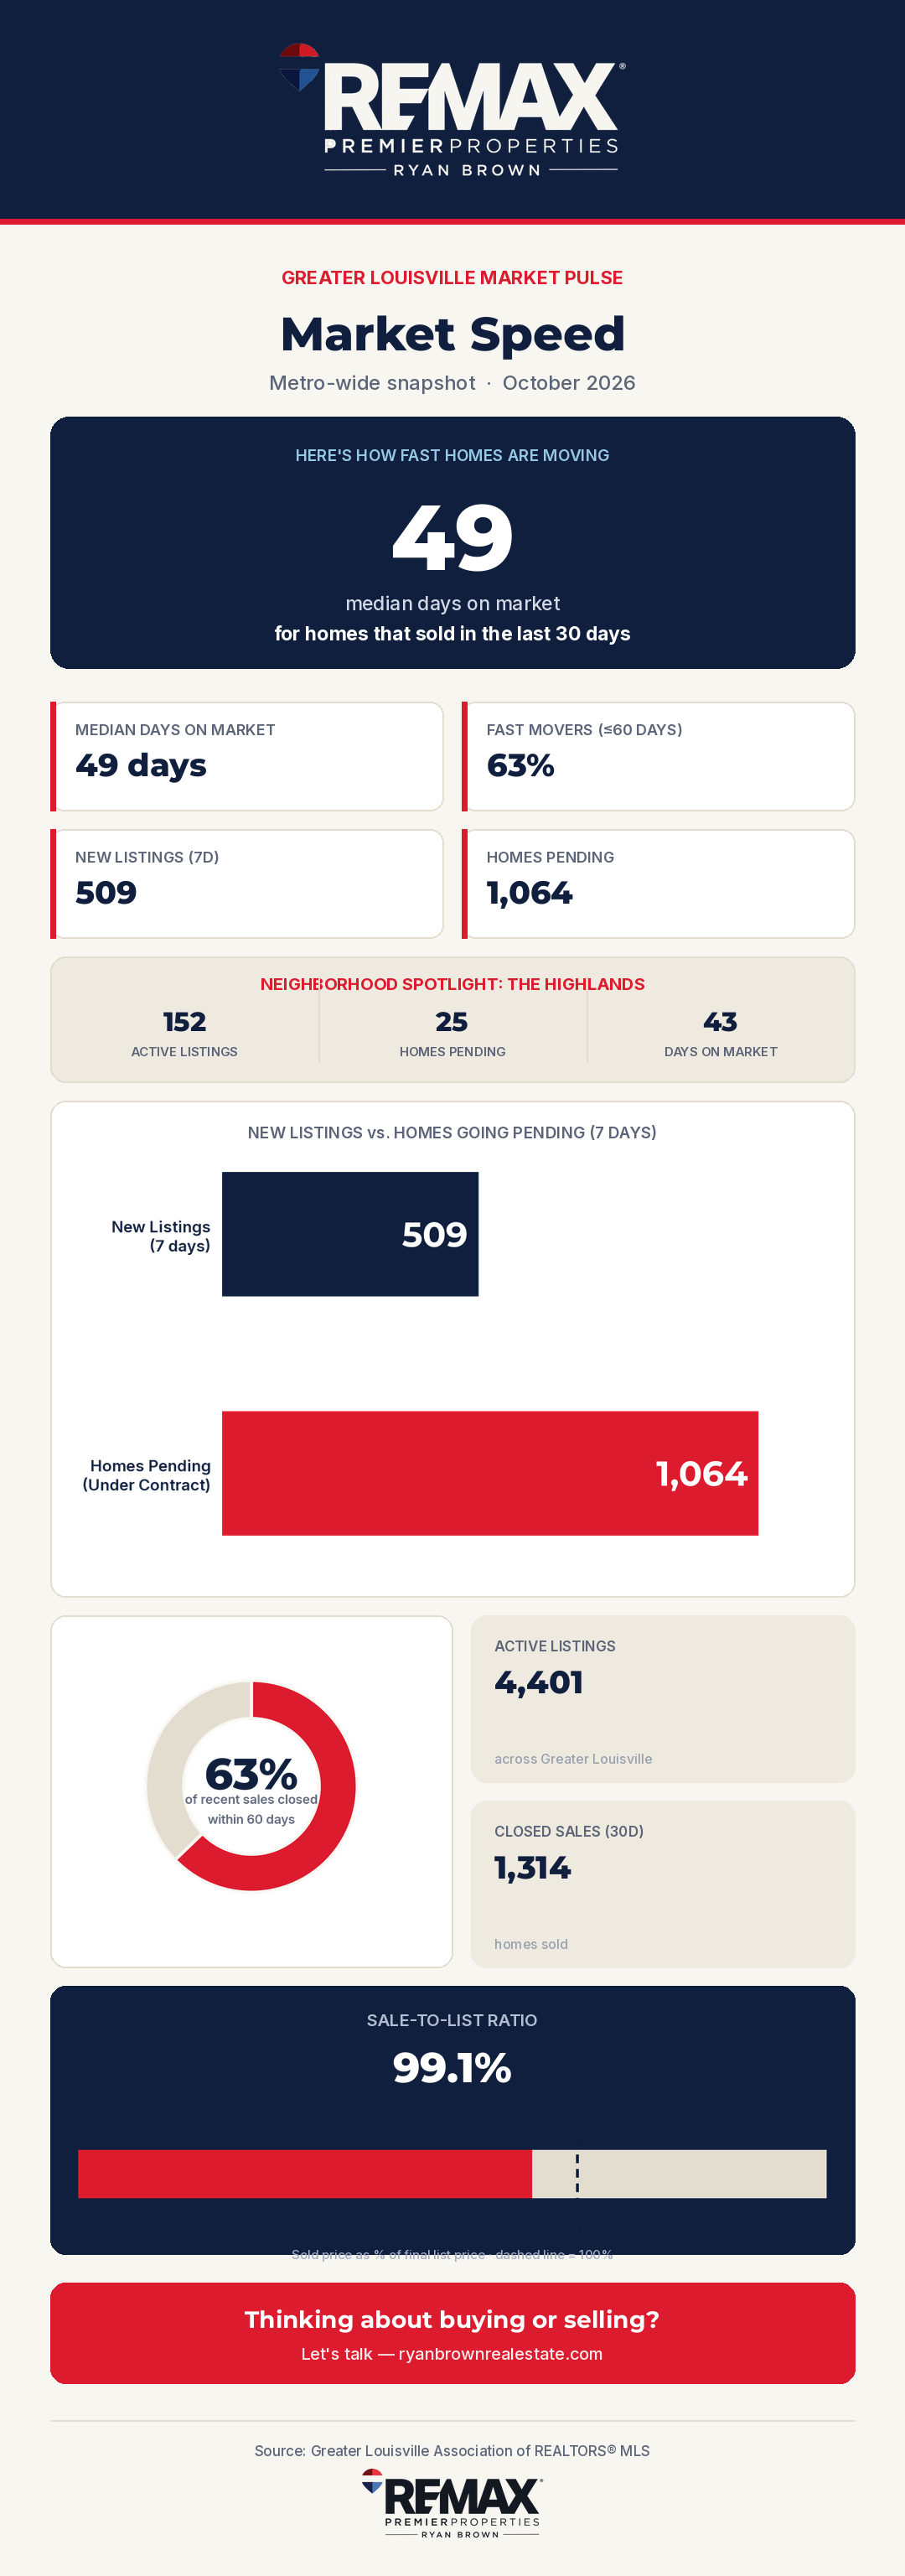 Market Speed
October 2026
Louisville Market Speed: October 2026 Update
Homes in Greater Louisville are closing a median of 49 days after listing, with a the Highlands spotlight this edition.
Read the snapshot →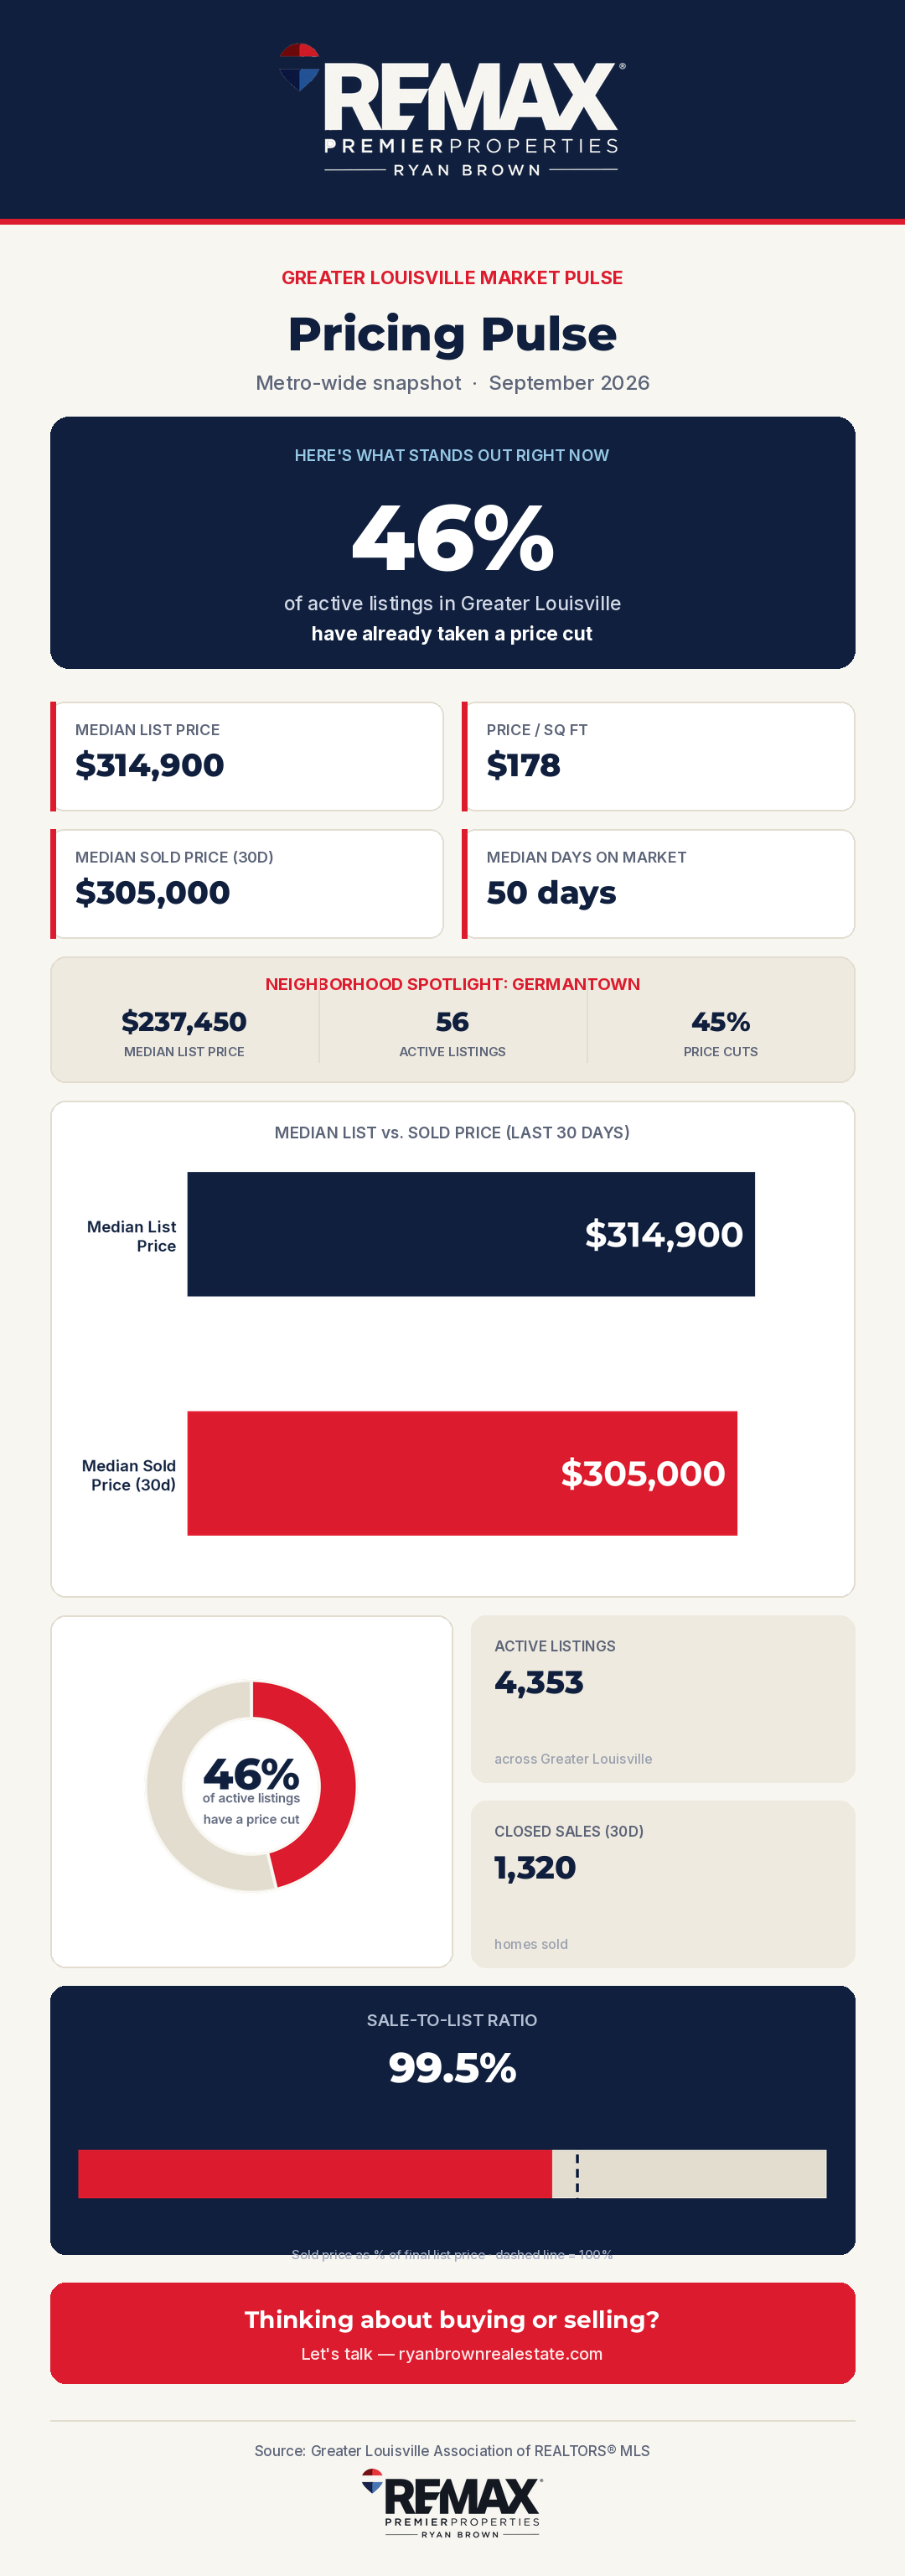 Pricing Pulse
September 2026
Louisville Market Pulse: September 2026 Pricing Snapshot
46% of active listings across Greater Louisville have already taken a price cut, with a Germantown spotlight this edition.
Read the snapshot →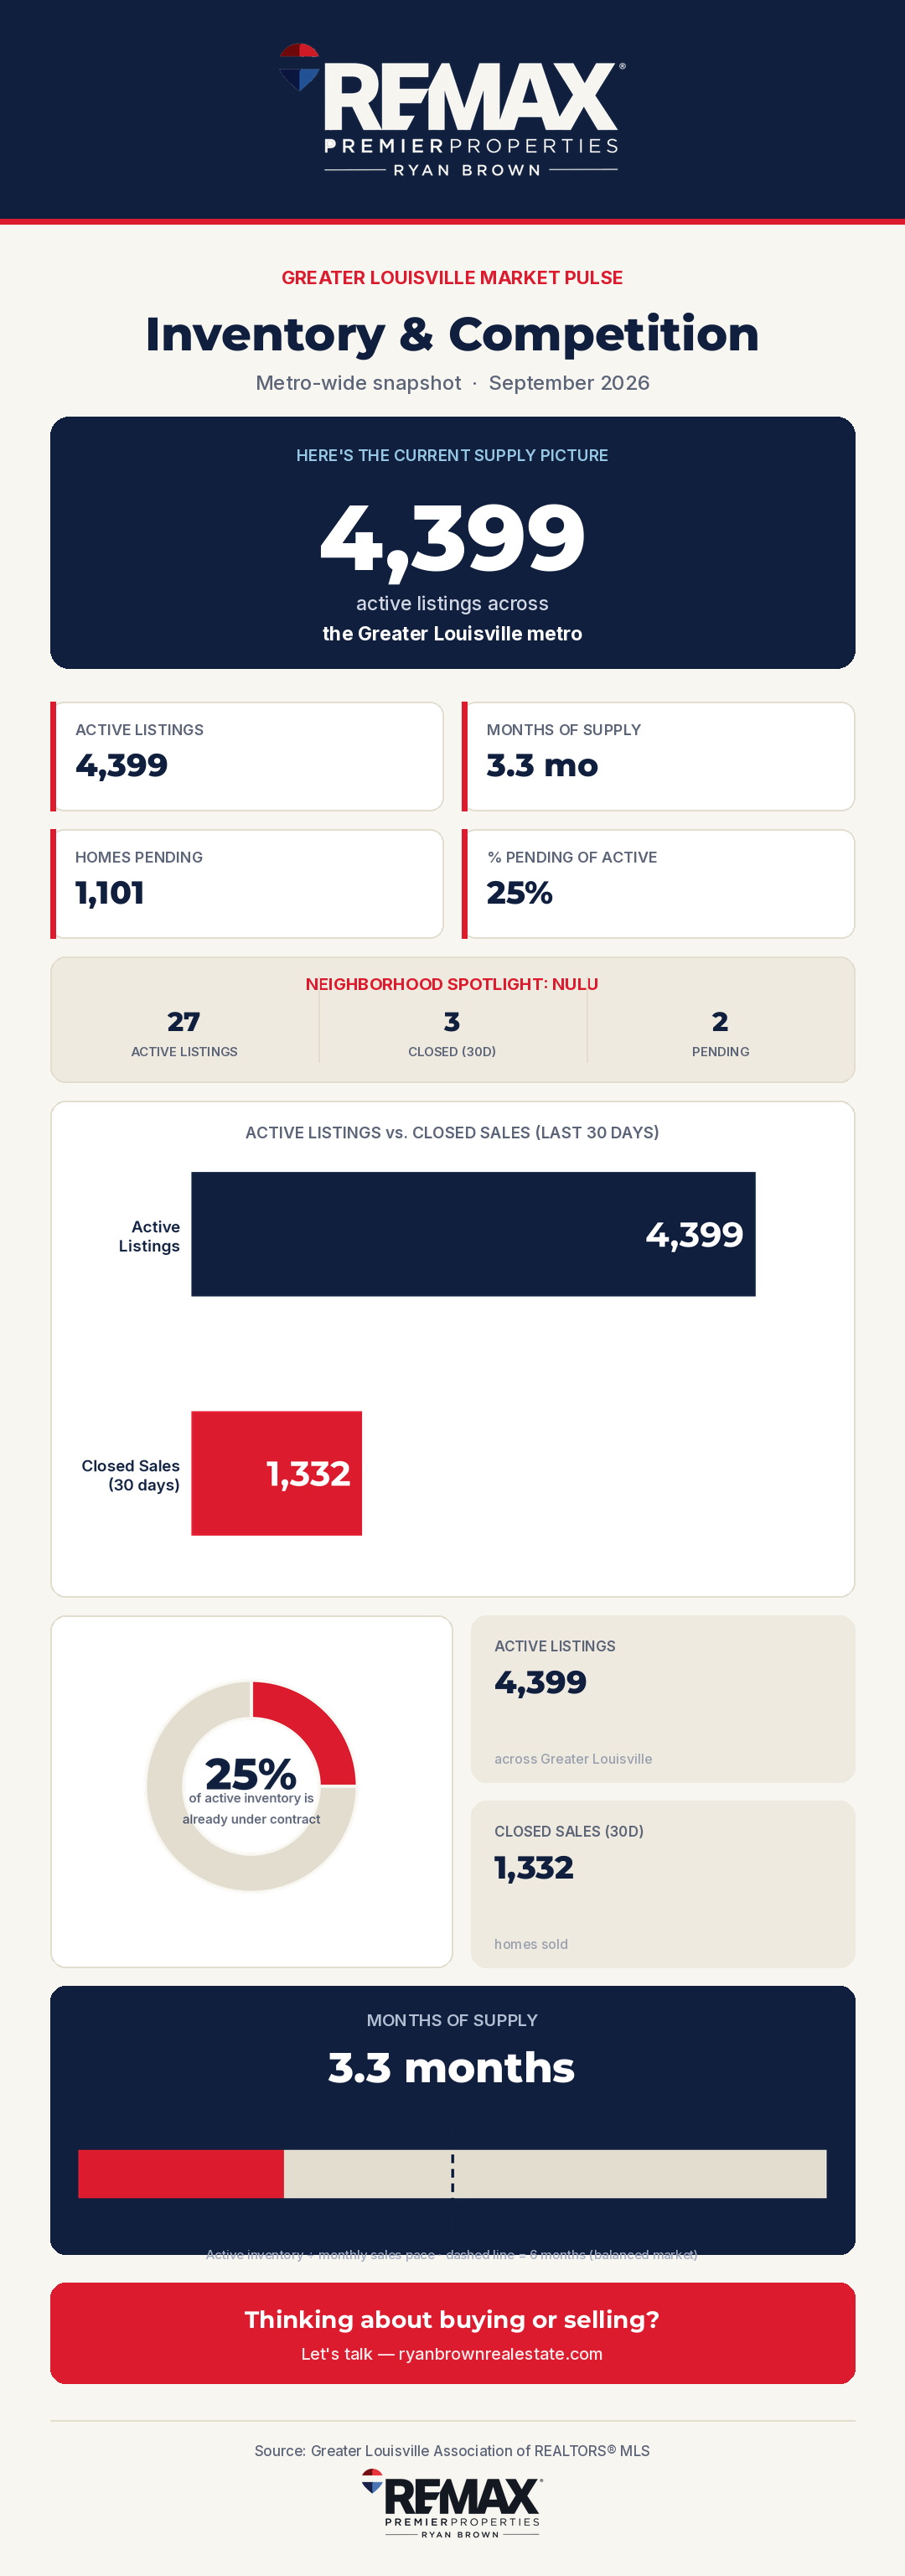 Inventory & Competition
September 2026
Louisville Inventory & Competition: September 2026 Update
4,399 active listings across Greater Louisville, 3.3 months of supply, with a NuLu spotlight this edition.
Read the snapshot →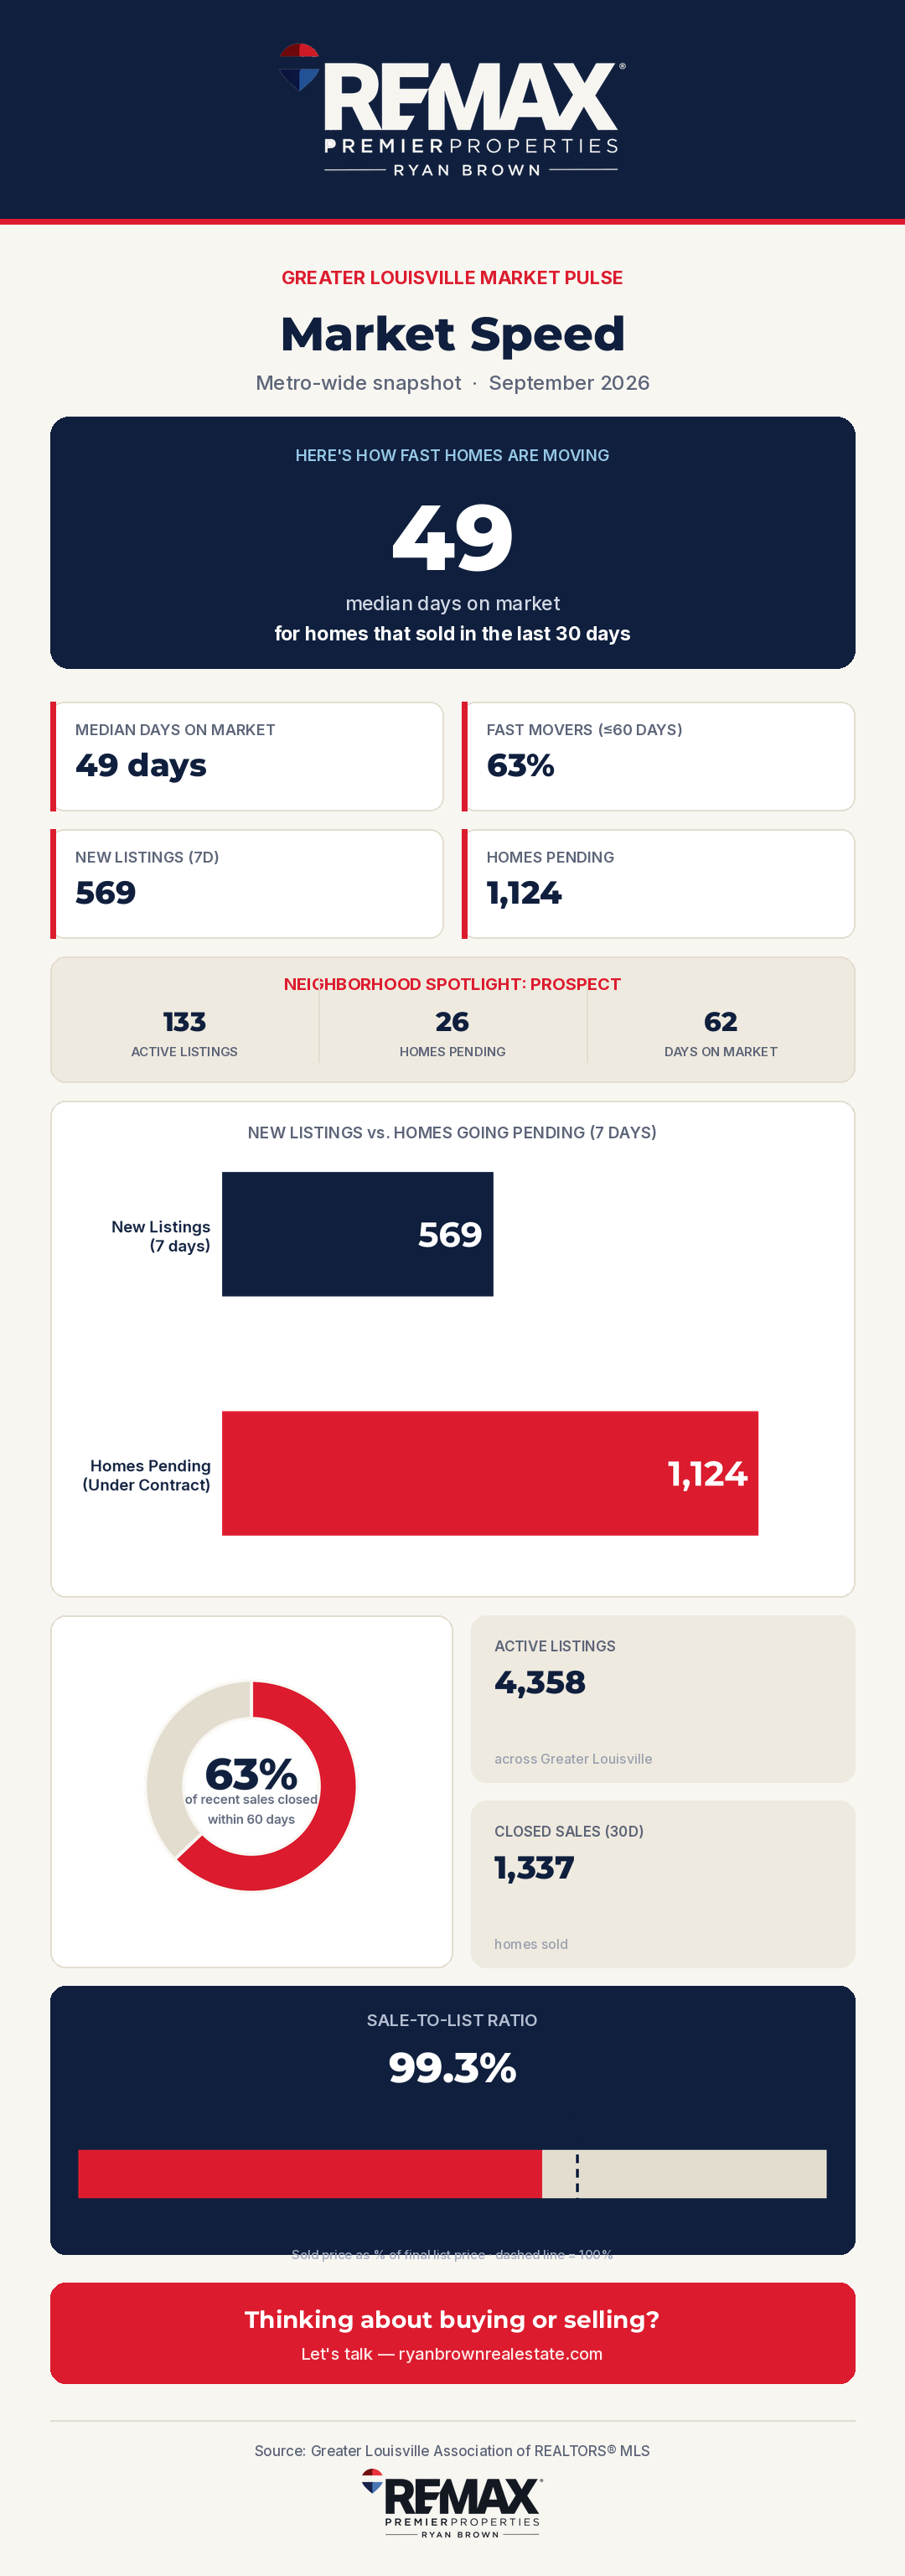 Market Speed
September 2026
Louisville Market Speed: September 2026 Update
Homes in Greater Louisville are closing a median of 49 days after listing, with a Prospect spotlight this edition.
Read the snapshot →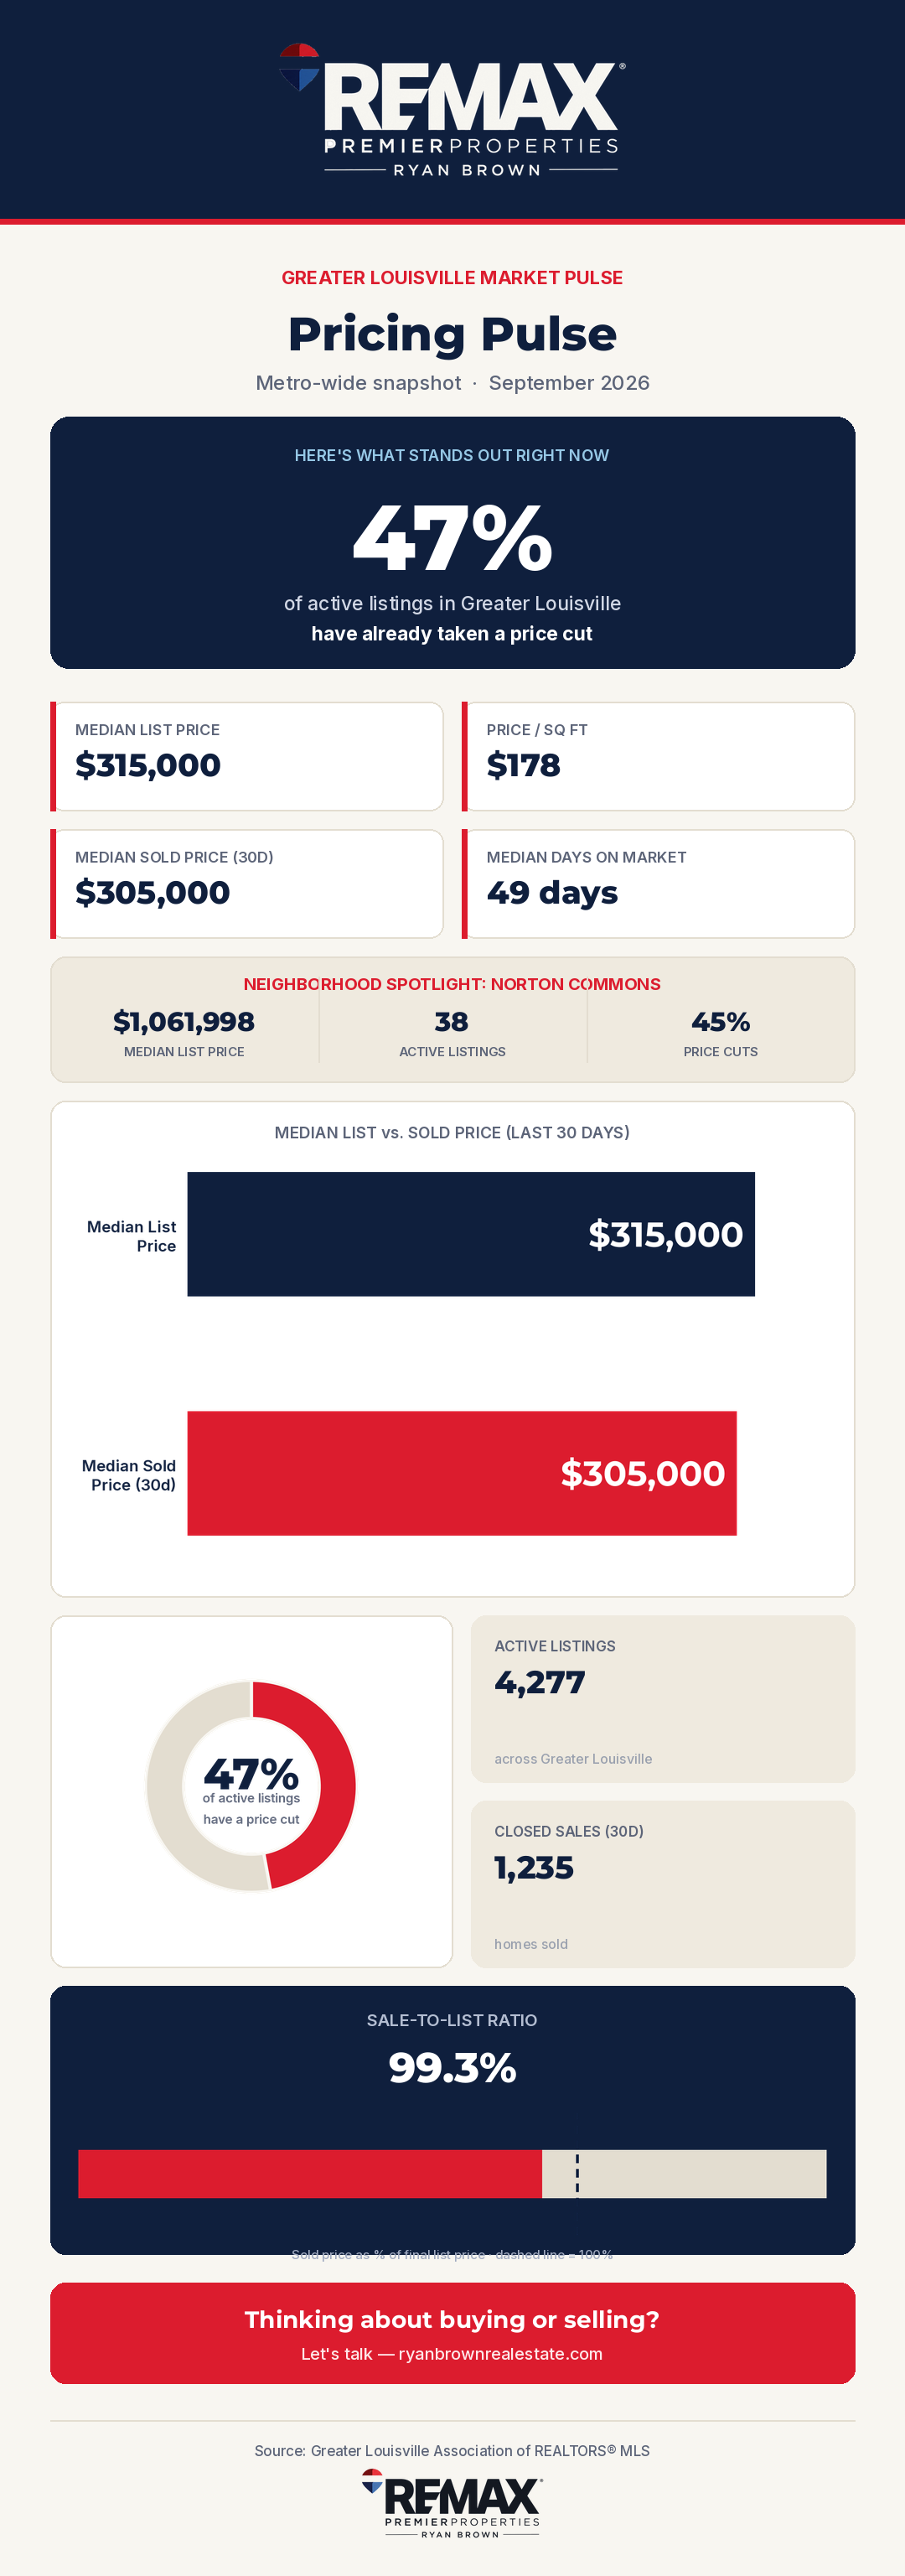 Pricing Pulse
September 2026
Louisville Market Pulse: September 2026 Pricing Snapshot
47% of active listings across Greater Louisville have already taken a price cut, with a Norton Commons spotlight this edition.
Read the snapshot →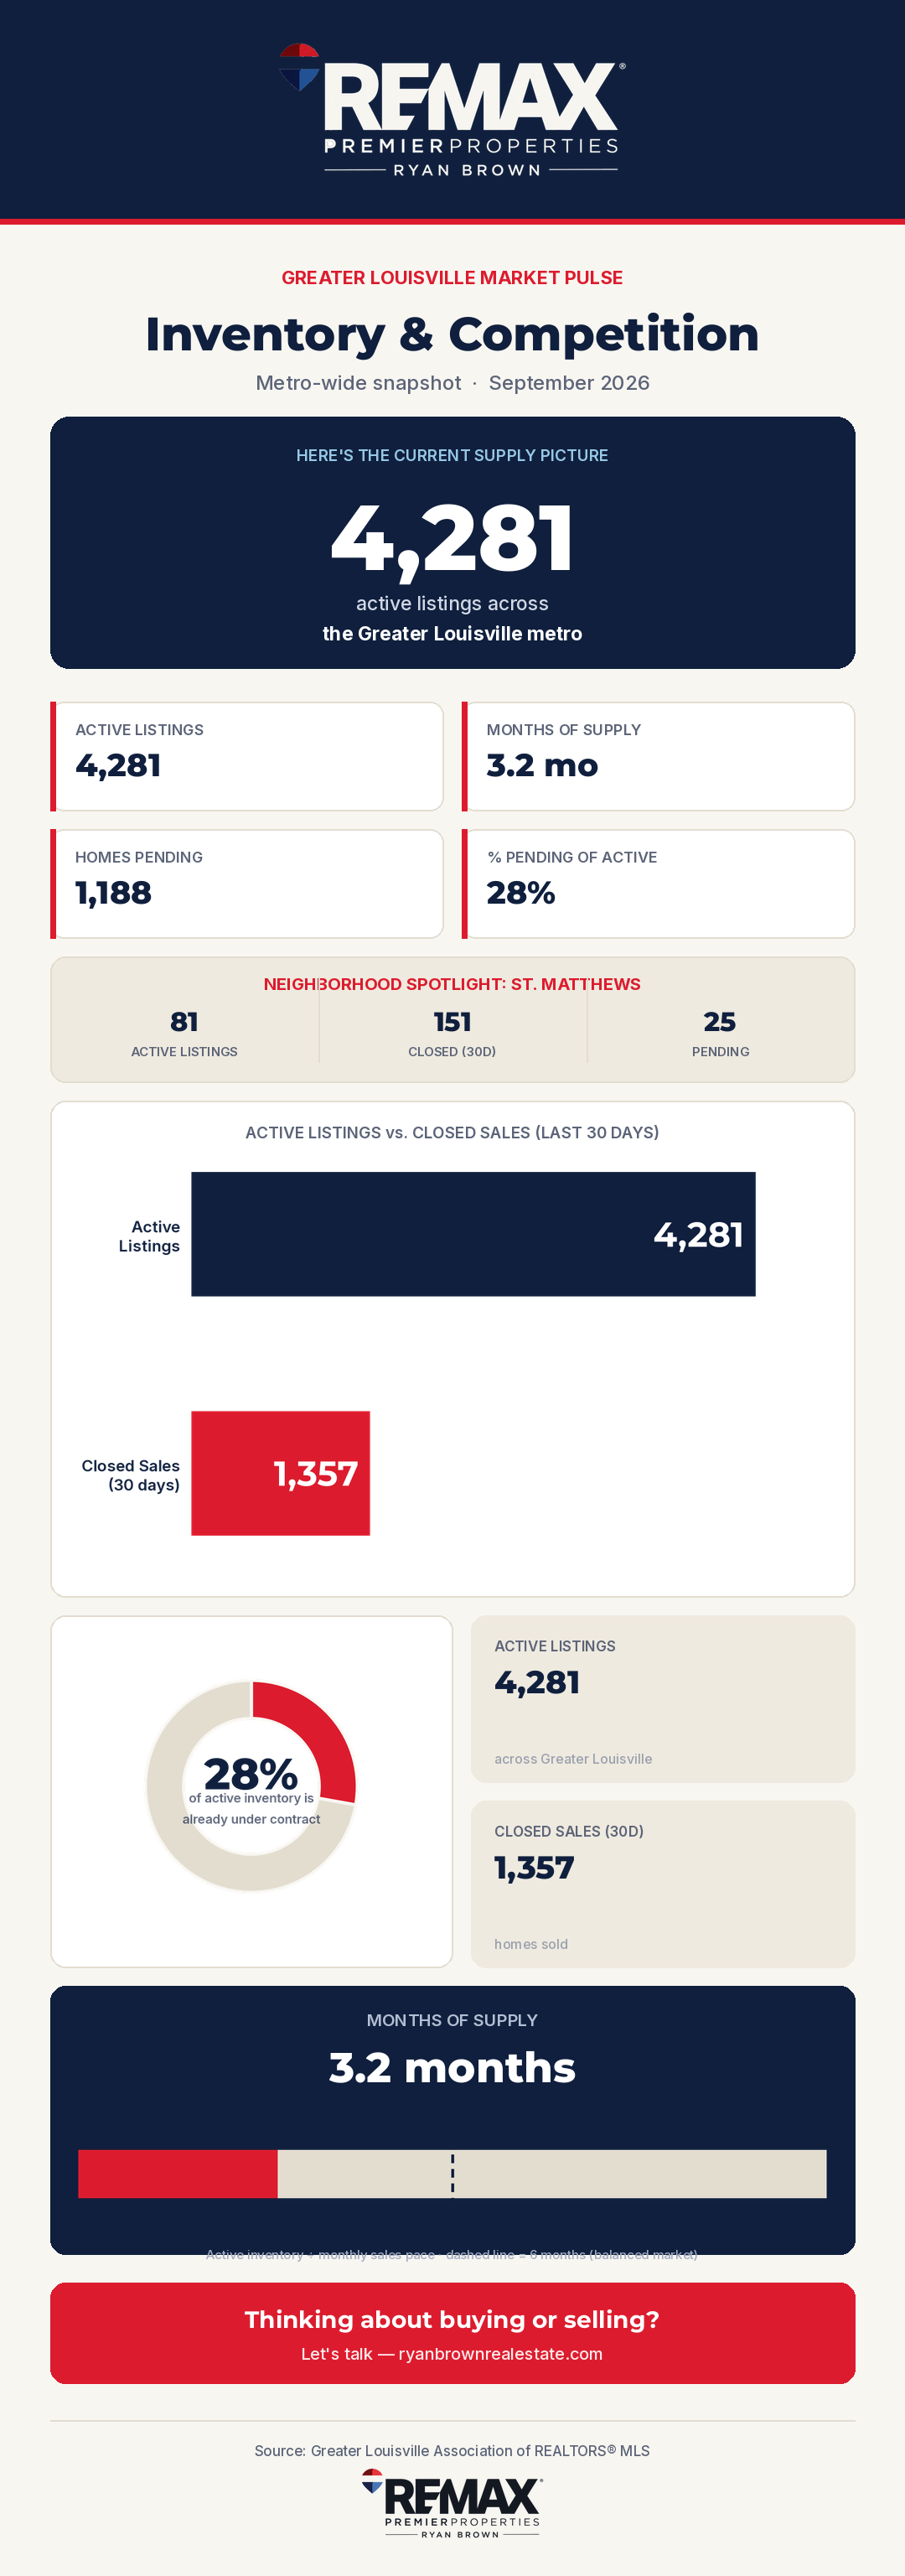 Inventory & Competition
September 2026
Louisville Inventory & Competition: September 2026 Update
4,281 active listings across Greater Louisville, 3.2 months of supply, with a St. Matthews spotlight this edition.
Read the snapshot →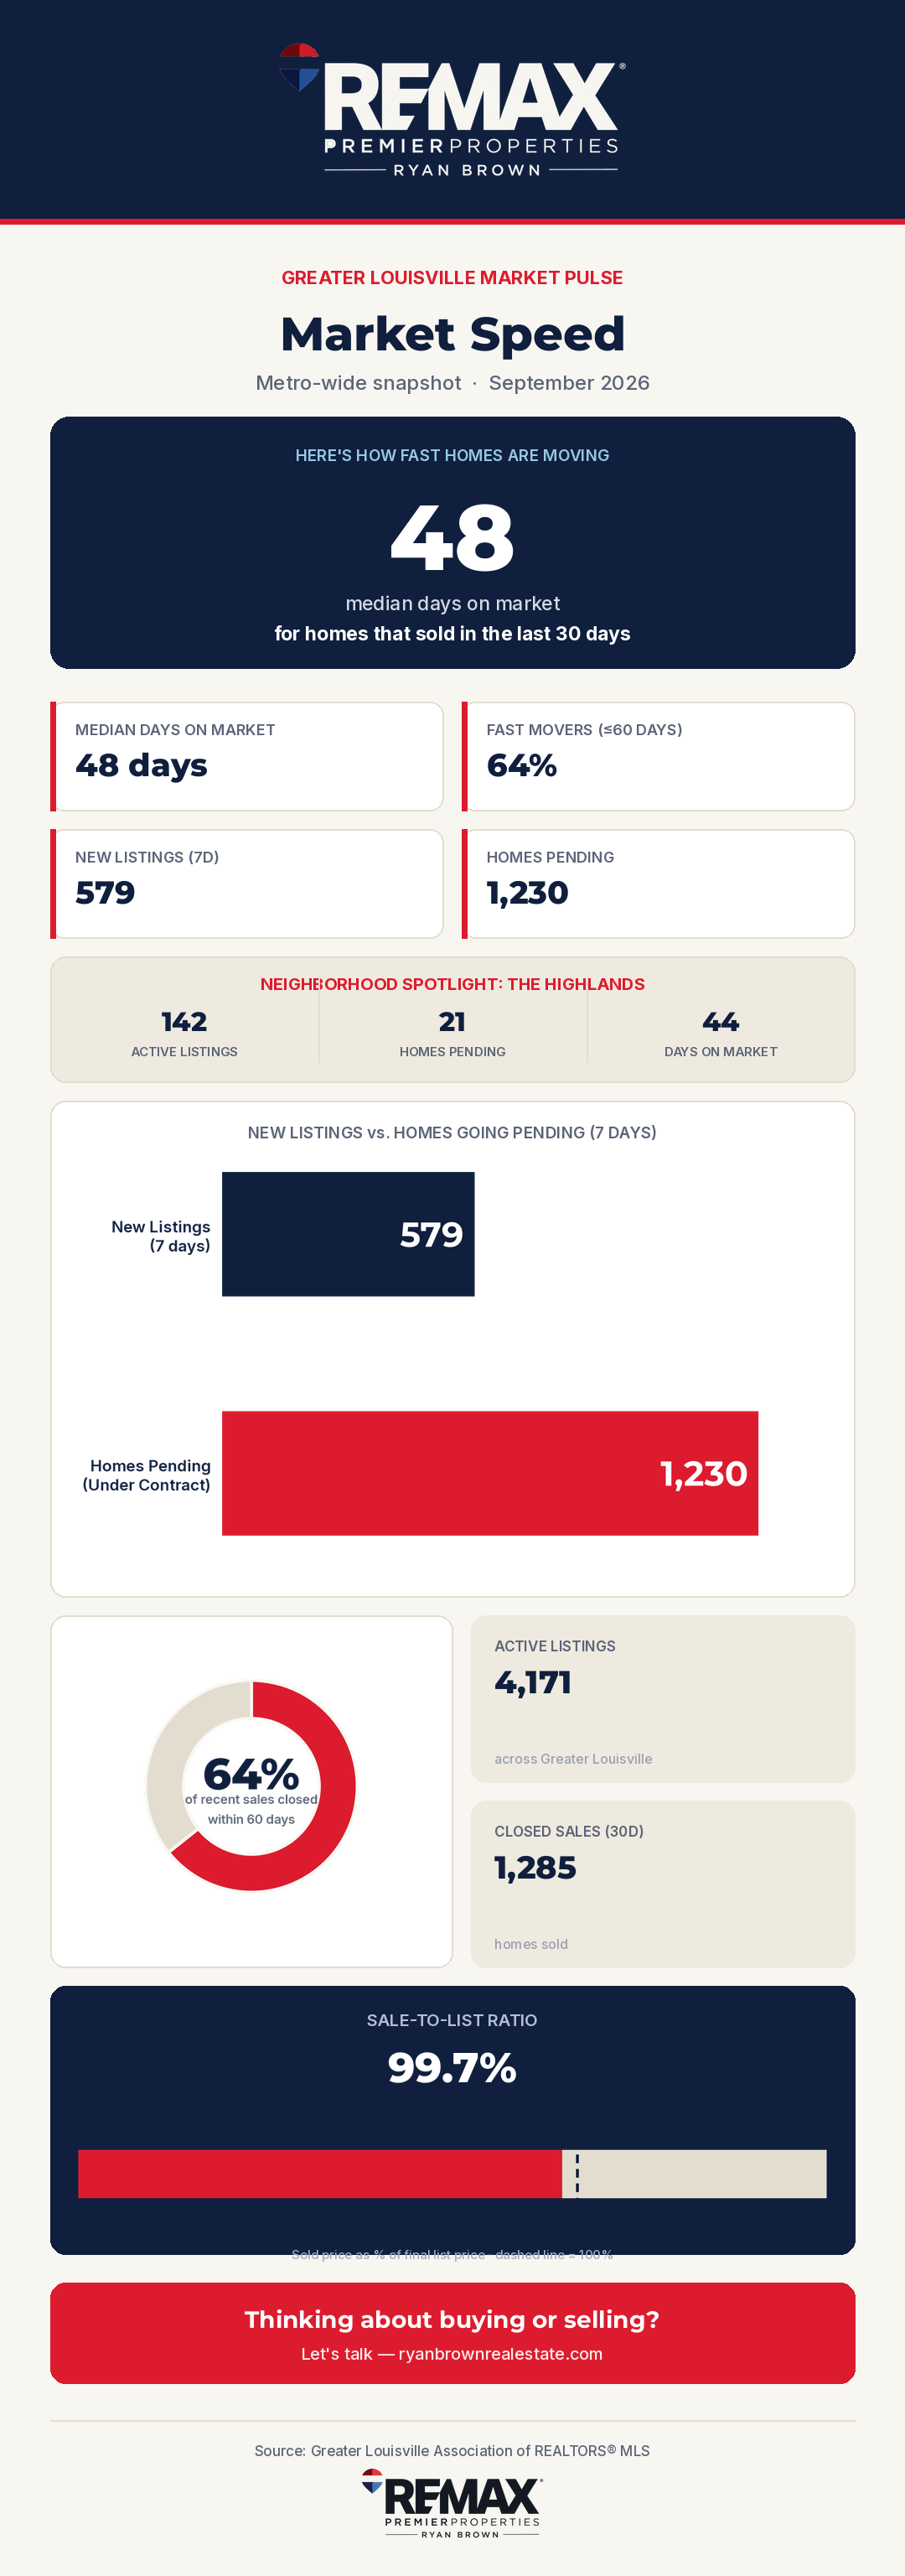 Market Speed
September 2026
Louisville Market Speed: September 2026 Update
Homes in Greater Louisville are closing a median of 48 days after listing, with a Highlands spotlight this edition.
Read the snapshot →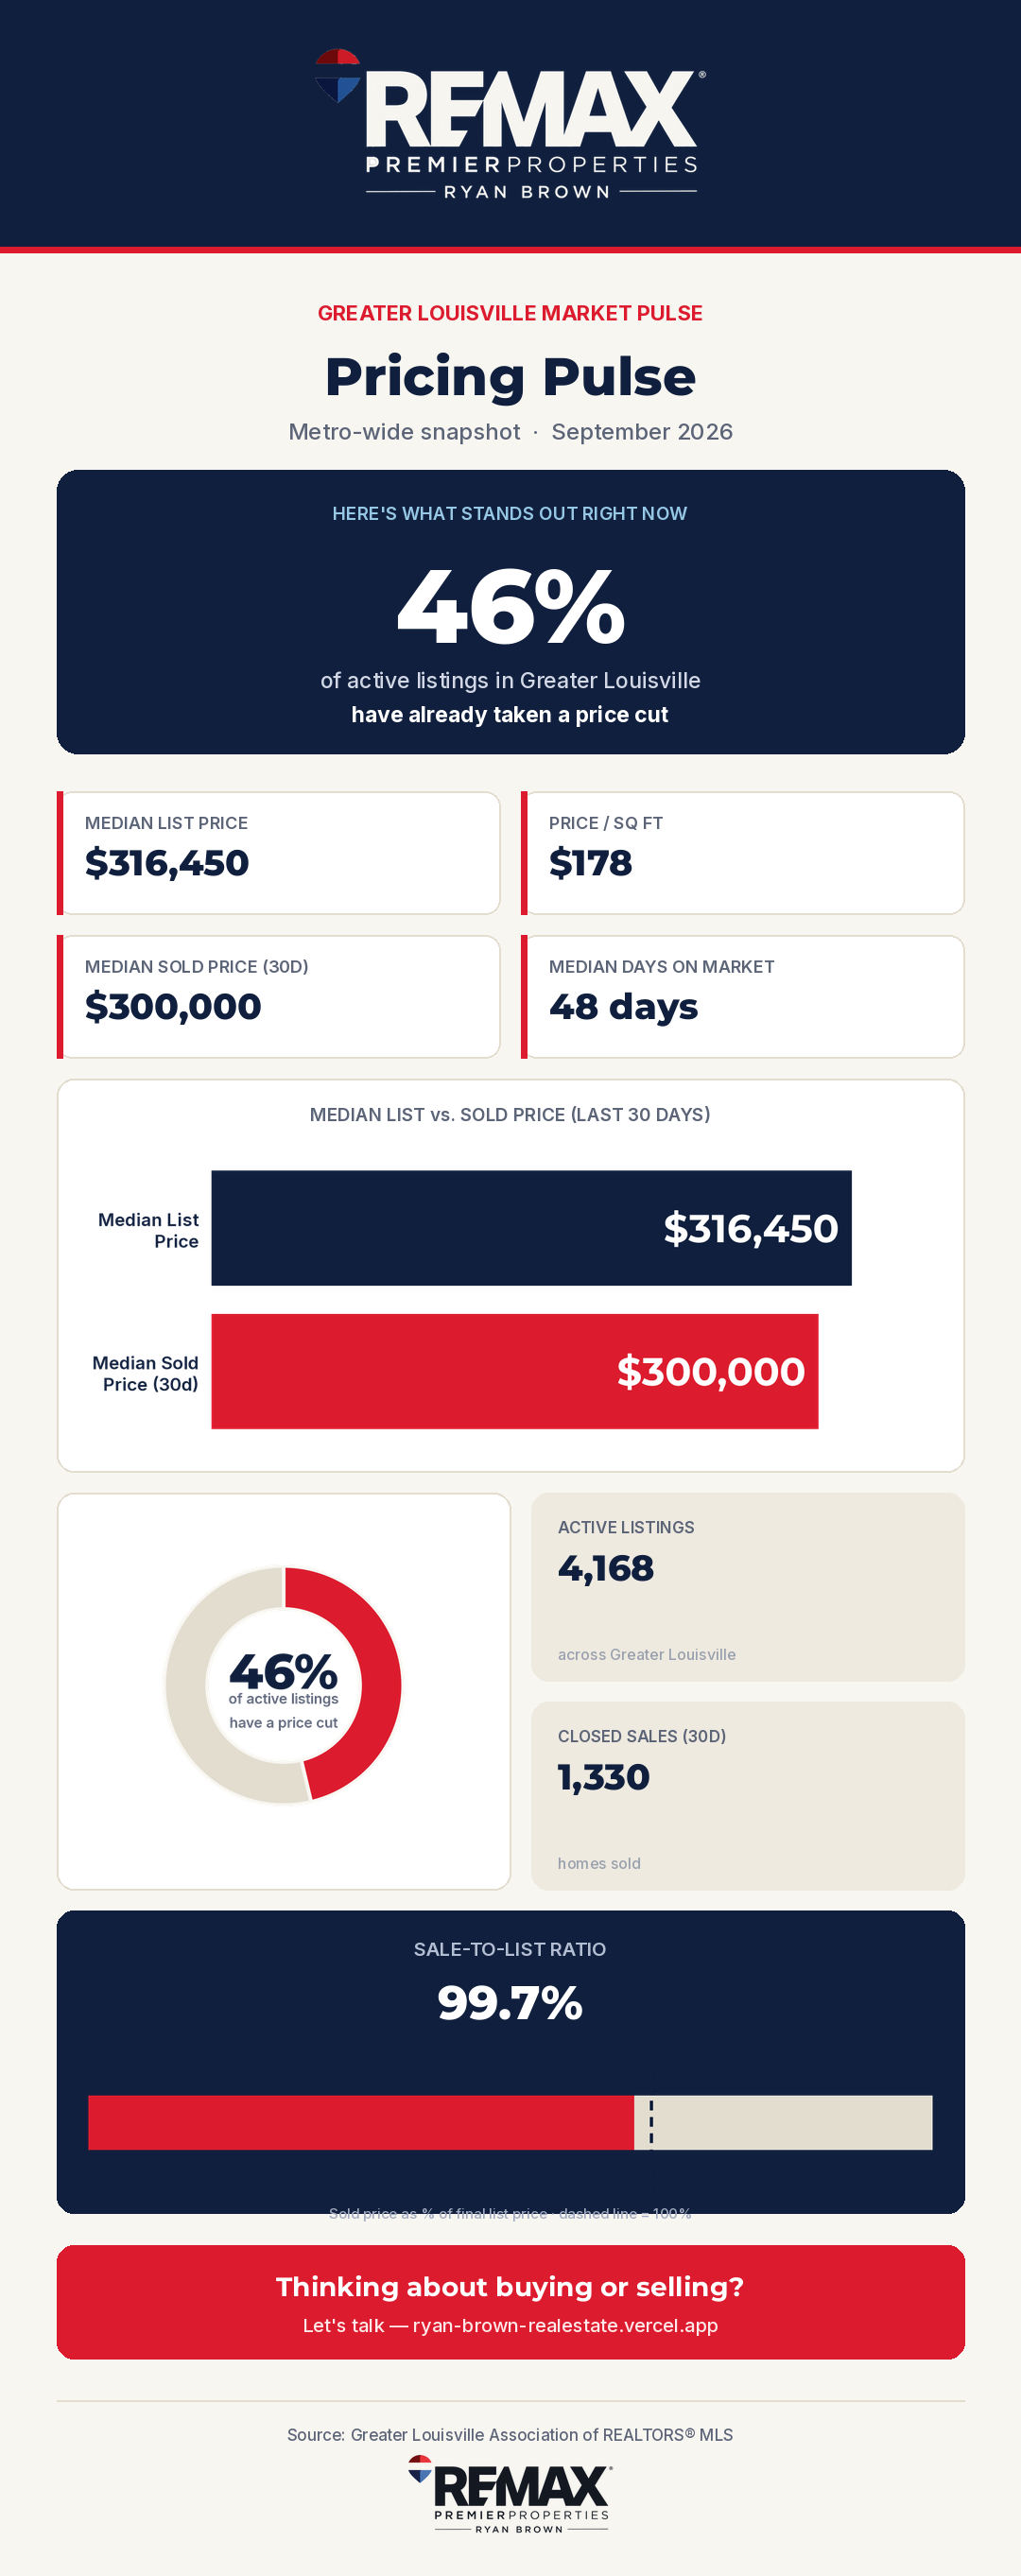 Pricing Pulse
September 2026
Louisville Market Pulse: September 2026 Pricing Snapshot
46% of active listings across Greater Louisville have already taken a price cut. Here's what's happening with list prices, days from listing to closing, and sale-to-list ratio right now.
Read the snapshot →New market snapshot posted regularly, cycling through pricing, market speed, and inventory data across Greater Louisville. Check back any time for the latest numbers.
Three numbers that actually tell you what's happening.
Every edition of the Greater Louisville Market Pulse pulls straight from GLAR MLS data and rotates through three angles on the same market. Here's what each one means for you.
Pricing Pulse
Tracks median list price, the share of active listings that have taken a price cut, and sale-to-list ratio. This is the clearest signal of whether buyers or sellers currently have the upper hand on price.
Market Speed
Tracks how long homes take from listing to closing, and how that's trending month over month. Faster is a seller's market signal; slower usually means buyers have more room to negotiate on price and terms.
Inventory & Competition
Tracks total active listings and months of supply — the number of months it would take to sell through current inventory at the current sales pace. Below ~4 months typically favors sellers; above ~6 months typically favors buyers.
What people ask about these updates.
Where does the data come from?
Every snapshot pulls current figures from the Greater Louisville Association of REALTORS® (GLAR) MLS — the same data licensed agents use, not a third-party estimate site. Numbers reflect the Greater Louisville metro area unless a specific neighborhood spotlight is noted.
Read the full guide: Where these numbers come from, and how often they update
How often is a new snapshot posted?
New editions are added on a rolling basis, cycling through pricing, market speed, and inventory & competition themes, each paired with a rotating neighborhood spotlight from across Greater Louisville.
Read the full guide: Where these numbers come from, and how often they update
Should I make a buying or selling decision based on these numbers alone?
Treat these as a general pulse on the metro, not a substitute for a property-specific analysis. Median metro-wide numbers can mask big differences between neighborhoods — a subdivision like Norton Commons can behave very differently from an urban infill market like Old Louisville in the same month. Reach out and I'll pull the actual comparable data for your specific street or price range.
Read the full guide: Should you decide to buy or sell based on these numbers?
Can I get these updates sent directly to me?
Text or email me and I'll add you to the list, or set up a custom saved search for your target neighborhood and price range so you see new listings and price changes as they happen — not just the metro-wide averages.
Read the full guide: Getting market updates and saved searches